Crime & Justice
Did Police Funding Cuts Cause the 2020 Crime Surge?
Firearm homicide rose 46% by 2021, police budgets were not broadly cut, and what the four-city study found.
Crime & Justice
Which Side Commits More Political Violence?
Deaths and attacks by side in the counts of CSIS, Cato, New America and ADL, and what moves the totals.
Crime & Justice
Does Gun Control Reduce Violence?
RAND’s 144 policy-outcome pairings: 18 with an effect, 50 inconclusive, 76 with no qualifying study.
Why Does the U.S. Have More Gun Deaths?
The United States loses more people to guns, for its population, than its high-income peers. This page measures that gap against twelve of them and splits it into suicide and homicide. It then weighs the explanations offered for it: the number of guns, violence without guns, mental health, poverty and gun laws.
Jump to the verdict ↓
The short answer
Mostly its guns, though no study has yet measured how much of the gap they cause. In 2024 Americans were killed without a gun at 1.2 times Canada’s rate, but with one at six and a half times. At the end of 2017 the country had more civilian guns than people, more per head than any other. And among U.S. suicidal acts that ended in death or hospital care, nine in ten with a gun were fatal, against one in twelve overall.
The International Gap
On the Global Burden of Disease study’s age-standardised rates for 2019, the U.S. firearm death rate is nearly five times France’s, the next highest of twelve other high-income countries. It is roughly 50 times the United Kingdom’s and 100 times Japan’s. Its firearm homicide rate, 4.1 per 100,000 people, is eight times Canada’s, the next highest. Its firearm suicide rate, 5.8, is more than three times France’s and Switzerland’s. On the same study’s later estimates, the U.S. rate was 13.2 per 100,000 in 2023 (Pew Research Center).
The chart and table below give every country’s rate on that one dataset.
How to read it: each bar is one country’s firearm deaths per 100,000 people in 2019, counting homicides, suicides and unintentional deaths together. The rates are age-standardised so that countries with older or younger populations compare fairly. A longer bar means more deaths per person. The red bar is the United States. Every value is in the table below.
| Country | All firearm deaths | Homicide | Suicide |
|---|---|---|---|
| United States | 10.4 | 4.1 | 5.8 |
| France | 2.2 | 0.3 | 1.7 |
| Switzerland | 2.1 | 0.2 | 1.7 |
| Canada | 2.1 | 0.5 | 1.5 |
| Norway | 1.2 | 0.1 | 1.1 |
| Sweden | 1.1 | 0.3 | 0.8 |
| New Zealand | 0.9 | 0.2 | 0.7 |
| Germany | 0.7 | 0.1 | 0.6 |
| Netherlands | 0.5 | 0.2 | 0.2 |
| United Kingdom | 0.2 | 0.0 | 0.1 |
| South Korea | 0.1 | 0.0 | 0.0 |
| Japan | 0.1 | 0.0 | 0.0 |
| Singapore | 0.0 | 0.0 | 0.0 |
Source: Institute for Health Metrics and Evaluation, Global Burden of Disease 2019, as charted by the Commonwealth Fund (April 2023). Totals include unintentional firearm deaths, so the homicide and suicide columns do not always add up to the total. Australia is in the Commonwealth Fund’s charts but is left out here because its three figures there do not agree with each other.
Suicide and HomicideMost U.S. firearm deaths are suicides. In 2024, on final data from the Centers for Disease Control and Prevention (CDC), gun deaths fell for the third year running, to 44,447. Gun homicides dropped 14% to 15,364. Gun suicides rose to a record 27,593, 62% of the total.
The gap with other countries is about half suicide and half homicide, though. In 2019 the U.S. rate was 8.2 per 100,000 higher than France’s. Of that gap, 4.1 was suicide and 3.8 homicide.
If you are thinking about suicide, or worried about someone who is, helplines in the United States and other countries answer calls and texts at any hour.
Firearm Homicide
The U.S. firearm homicide rate is where the international gap is widest. On the Global Burden of Disease study’s age-adjusted rates for 2021, it was 19 times France’s, 33 times Australia’s and 77 times Germany’s (Institute for Health Metrics and Evaluation).
Set against two peers whose police statistics record the method of each homicide, Canada and England and Wales, the homicide gap is a gun gap. In 2024, 76% of U.S. homicides involved a gun, 15,364 of 20,162, on Centers for Disease Control and Prevention (CDC) counts via Pew. The remaining 4,798 did not.
| Country and year | All homicides | With a gun | Without a gun |
|---|---|---|---|
| United States, 2024 | 5.9 | 4.5 | 1.4 |
| Canada, 2024 | 1.9 | 0.7 | 1.2 |
| England and Wales, year to March 2025 | 0.9 | 0.05 | 0.8 |
Crude rates, not age-adjusted. United States: CDC counts via Pew, over the Census Bureau’s July 2024 estimate of 340,003,797 (Vintage 2025). Canada: Statistics Canada, 788 homicides and 287 firearm-related in 2024, 1.91 per 100,000, shooting homicides 0.69 per 100,000. England and Wales: the Office for National Statistics’ 8.6 homicides per million from the Homicide Index, and the 32 homicides by shooting it reports from the same index. The two smaller figures are computed from those and the 522 victims in all. The U.S. and Canadian years run January to December; England and Wales runs April to March.
On these rates, Americans are killed without a gun at about 1.2 times the Canadian rate and 1.7 times the rate in England and Wales. With a gun they are killed at 4.5 per 100,000, six and a half times Canada’s 0.69. Against about 0.05 in England and Wales, it is more than 80 times.
Download this conclusion: the gun gap
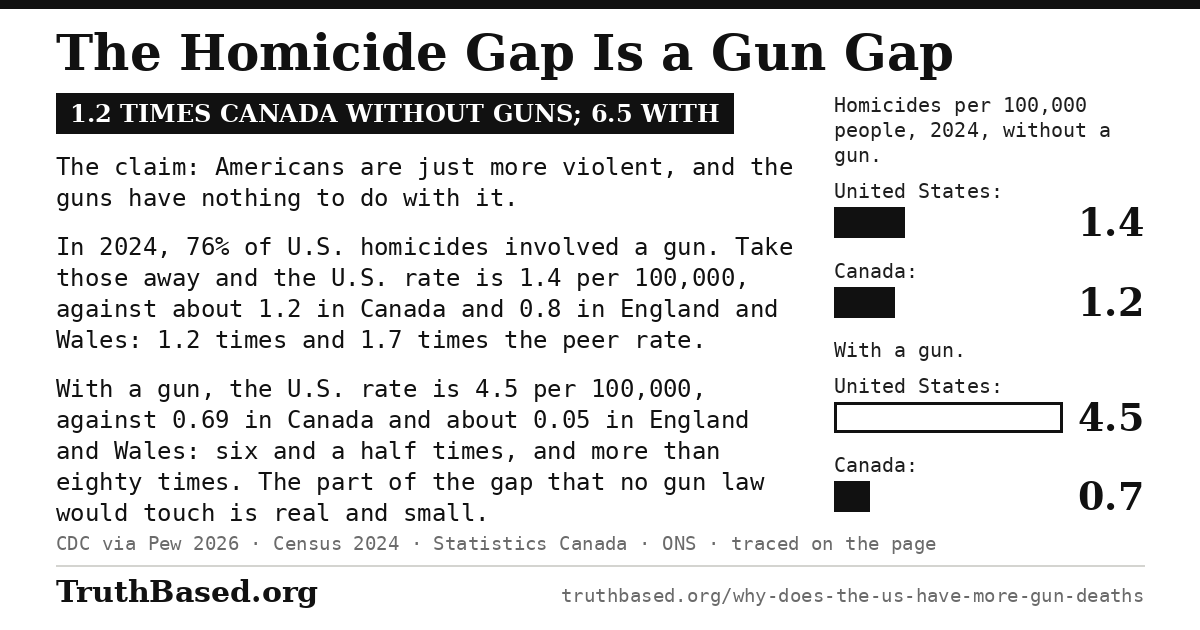
This card takes apart the idea that Americans are simply more violent. Without a gun the U.S. homicide rate is 1.4 per 100,000, against Canada’s 1.2 and England and Wales’s 0.8. With a gun it is 4.5, against 0.69 in Canada and about 0.05 in England and Wales. Anyone may download it and post it.
Firearm Suicide
The U.S. gun suicide rate was 7.6 per 100,000 people in 2024, about equal to the record 7.7 of 1977 (Centers for Disease Control and Prevention, age-adjusted, via Pew). In 2024, 57% of all U.S. suicides were by firearm, 27,593 of 48,824.
Whether People Switch MethodsThe question that decides gun suicide policy is whether people denied a gun switch to another method or do not die. The evidence runs against full substitution.
When the Israeli army required soldiers to leave their weapons on base during weekend leave, in 2006, the total suicide rate fell 40% (Lubin et al., 2010). Most of the fall was in weekend firearm suicides, and weekday suicides did not rise to make up for it.
After Australia’s 1996 National Firearms Agreement and buyback, firearm suicides fell faster than before (Chapman et al., 2006; Leigh and Neill, 2010). Both studies also found little sign of a lasting rise in suicides by other means. Suicides by other means fell too in the years after 1997, so how much of the fall the reforms caused is disputed; the policy section below gives the dispute.
In a national study, Conner, Azrael and Miller (2019) looked at suicidal acts from 2007 to 2014 that ended in death or in emergency or hospital care. Of those acts, 8.5% were fatal. Of acts with a firearm, 89.6% were, the highest of any method. Drug poisoning was 59% of acts and 13.5% of deaths.
The explanation the studies offer is the crisis window: the acute period of heightened risk is often only minutes or hours long (Harvard’s Means Matter project, citing Hawton, 2007). An attempt made in that window with a method other than a gun is far more likely to be survived.
Mass Shootings Compared
On a consistent definition, the U.S. is an outlier among its peers. The definition counts shootings in a public place that killed four or more, excluding the shooter, with victims chosen at random or for what they represent. It excludes family, felony and organised terrorist attacks.
Jason Silva’s count for the Regional Gun Violence Research Consortium found 109 public mass shootings in the United States between 2000 and 2022. Across 35 comparable countries it found 35. The United States held a third of those 36 countries’ population. It had 76% of their public mass shootings and 70% of the deaths. France, Germany and Canada each had four or more over the 23 years; more than half of the comparison countries had none.
Looser definitions count far more: the Gun Violence Archive counts incidents in which four or more people are shot, killed or not, and recorded 502 in 2024. On any definition, mass shooting deaths are a small fraction of gun homicides (Pew, from Federal Bureau of Investigation and Gun Violence Archive data).
Australia After Port ArthurAustralia’s 1996 gun laws followed the killing of 35 people at Port Arthur, Tasmania, that April. Chapman, Alpers and Jones (Journal of the American Medical Association, 2016) counted 13 fatal mass shootings, five or more killed, in the 18 years before the 1996 laws. They counted none from 1997 to May 2016. The policy section below has the rest of the Australian evidence and what it does not show.
What Drives the U.S. Difference
At the end of 2017 the United States had 120.5 civilian firearms per 100 residents, more guns than people and by far the highest rate in the world. Yemen was the next-highest country, at 52.8. The U.S. civilian stock was about 393 million, 46% of the world’s 857 million. U.S. civilians acquired at least 122 million new or imported firearms between 2006 and 2017 (Small Arms Survey, 2018).
About four in ten U.S. adults live in a household with a gun, and 32% own one themselves (Pew, June 2023); the owner share has changed little since 2017.
Set beside the firearm death rates in the international table, the country with by far the most guns per person has by far the most firearm deaths. Among Canada, France, Germany and Japan the pattern is loose. A comparison of five countries cannot separate guns from anything else that differs between them, such as poverty or inequality.
| Country | Civilian guns per 100 people, end of 2017 | Firearm deaths per 100,000, 2019 |
|---|---|---|
| United States | 120.5 | 10.4 |
| Canada | 34.7 | 2.1 |
| France | 19.6 | 2.2 |
| Germany | 19.6 | 0.7 |
| Japan | fewer than one | 0.1 |
On everyday gun homicide, the weapon data point at handguns.
| Type of gun | Share of murders |
|---|---|
| Handguns | 53% |
| Rifles, the category that includes so-called assault weapons | 3% |
| Shotguns | 1% |
| Other or unstated types | 42% |
Campbell and colleagues’ 11-city study of abused women (2003) compared women killed by a partner with abused women who were not. In it, the abuser’s access to a gun raised the risk of being killed by more than five times, over and above the abuse itself.
Policy Evidence
After the Port Arthur killings, Australia banned semi-automatic rifles and pump-action shotguns and bought back more than 650,000 firearms, about 20% of the civilian stock.
Firearm suicide and homicide were already falling before 1996, and the studies disagree about how much the reforms added. Chapman’s 2016 study found that suicides and homicides by other means also turned downward after 1996, by more than the change in firearm deaths. So it concluded that it was not possible to determine whether the change in firearm deaths could be attributed to the reforms. Leigh and Neill found that the buyback cut firearm suicides, and that its effect on firearm homicide was similar in size but less precise.
The RAND Corporation, a nonprofit research organisation, reviewed the studies. Only one study found convincing evidence that firearm homicide changed, a fall in women killed. RAND judges the evidence consistent with the reforms reducing firearm suicides, mass shootings and killings of women, with doubts remaining for suicide.
RAND’s RatingsThe RAND Corporation’s systematic review, “The Science of Gun Policy”, published its fifth edition, the last RAND has scheduled, in January 2026.
RAND’s tiers:
- supportive is the highest;
- moderate means two or more studies found significant effects in the same direction and no study with equal or stronger methods contradicted them;
- limited means at least one qualifying study found a significant effect and none with equal or stronger methods contradicted it;
- inconclusive means studies of comparable rigour disagree, or a single study found only suggestive effects.
Inconclusive describes the studies and says nothing about the law.
The review’s evidence ratings for eight of its 18 policies:
| Policy | RAND Evidence Rating | Key Finding |
|---|---|---|
| Child access prevention laws | Supportive | Reduce firearm suicide among young people, unintentional firearm deaths among children, and firearm homicide and assault among young people |
| Minimum age for buying a gun | Supportive | Higher minimum ages reduce firearm suicide among young people |
| Red flag (extreme risk protection order) laws | Limited | Reduce firearm and total suicide |
| Waiting periods | Moderate | Reduce firearm suicide and total homicide |
| Background checks | Moderate | Dealer checks reduce firearm homicide; universal checks, which extend to private sales, reduce total homicide (moderate) and firearm homicide (limited) |
| Stand your ground laws | Supportive (for harm) | Increase firearm and total homicide |
| Shall-issue concealed carry | Supportive (for harm) | Increases firearm and total homicide and violent crime |
| Assault weapons and high-capacity magazine bans | Limited (magazines) | The magazine component has limited evidence of reducing mass shootings and their fatalities; effects on violent crime are inconclusive |
Source: RAND Corporation, “The Science of Gun Policy,” fifth edition, January 2026 (rand.org/research/gun-policy). This site’s companion article, Does Gun Control Reduce Violence?, goes through all 18 policies and 8 outcomes.
The Strongest Case on Each Side
The gap is where the guns are (see the homicide section). Whatever explains the gap without a gun, the weapon explains the gap with one.
On suicide, the method used largely decides how often an attempt ends in death. Taking guns out of reach lowered total suicide in the Israeli army (see the suicide section). An abuser’s access to a gun raised a woman’s risk of being killed more than fivefold in Campbell’s study. The RAND Corporation finds supportive evidence for child access prevention laws and minimum ages for buying a gun, and moderate evidence for waiting periods and background checks.
That It Is Not the GunsDefensive gun use is real and its scale is unknown. Estimates built on the government’s crime survey run from about 70,000 to 116,000 a year. Kleck and Gertz’s 1993 survey produced 2.2 to 2.5 million. RAND’s review calls the highest estimates implausible and the crime survey’s almost certainly too low. The range is a dispute about how to define and count a defensive use, and researchers and gun-rights advocates tend to cite different estimates.
About a third of American adults own a gun (Pew). A policy that restricts all of them to reach the people who misuse guns asks the law-abiding majority to carry the cost.
The guns used in crime mostly did not come through a shop. In a 2016 survey, 287,400 state and federal prisoners said they had a gun during the offence that put them inside. The table shows where they got it (Bureau of Justice Statistics). Nine in ten did not get it from a retail source, so a check at the counter touches the one in ten who went to a counter.
| Where they got it | Share |
|---|---|
| Off the street or from the underground market | 43% |
| Stole it | 6% |
| Found it at the scene | 7% |
| From family, a friend or as a gift | a quarter |
| Bought it under their own name from a licensed dealer | 7% |
| At a gun show | 0.8% |
Gun homicide is concentrated, and the programmes that target it need no new gun law. In focused deterrence, police and community groups confront the small groups of people responsible for a disproportionate share of crime. Across 24 evaluations it was associated with a moderate, statistically significant fall in crime (Braga, Weisburd and Turchan, 2019). But none of the 24 was a randomised trial, and the effects were smaller in the better-designed studies.
International comparisons are confounded. Inequality, poverty, drug markets and incarceration may drive violence on their own, and the 4,798 U.S. homicides without a gun in 2024 are the part no gun law would touch. Switzerland has 27.6 civilian guns per 100 people, among the 20 highest rates in the world, and 0.2 firearm homicides per 100,000.
The Constitution sets the field. In Heller (2008) the Supreme Court held that the Second Amendment protects an individual right to keep and bear arms for self-defence. Bruen (2022) extended it to carrying a handgun in public. It also requires any regulation to be consistent with the nation’s historical tradition of firearm regulation. A policy that works in Britain is not on offer here.
What the Evidence Settles
Most of the case that it is not the guns is true and beside the question. Defensive gun use, however common, is about what guns prevent, and the question here is why more people die. The law-abiding majority is real, and the largest share of the deaths involves no crime against anyone else: 27,593 of 2024’s gun deaths were people shooting themselves.
The prisoners’ answers are the argument for checks beyond the dealer’s counter, and the RAND Corporation rates universal background checks as having moderate evidence of reducing total homicide. The Constitution bounds what can be done about the gap and says nothing about why the gap exists.
The confounding argument is the serious one, and the page’s own numbers answer part of it. If poverty and inequality made Americans more violent, the violence would show without guns too. It does, a little: the homicide rate without a gun is 1.2 times Canada’s and 1.7 times England and Wales’s. It does not show at six and a half times or more than eighty.
On the suicide side, the U.S. firearm suicide rate is more than three times any peer’s. Conner’s study found that the method used largely explains how often attempts end in death. Switzerland fits the pattern that more guns go with more gun deaths, rather than breaking it. With 27.6 guns per 100 people, it has a firearm suicide rate of 1.7, the highest of the thirteen countries after the United States and level with France’s. Its total firearm death rate of 2.1 matches Canada’s, which has 34.7 guns per 100.
The evidence cannot yet put a number on how much of the gap the guns cause. The correlation across countries is a pattern, the natural experiments are on suicide and on one country’s reforms, and RAND’s ratings are for individual laws. RAND’s reviews find more guns linked with more violent crime without showing which causes which, and find the evidence on suicide consistent with guns raising the risk. How much poverty, inequality and culture add on top of the guns remains unsettled.
The verdict: what the evidence shows
Mostly the guns. Beside Canada and England and Wales, Americans are 1.2 to 1.7 times as likely to be killed without a gun. With one, they are six and a half to more than eighty times as likely to be killed. No other country has as many guns per person. A suicidal act with a gun ends in death far more often than one by any other means. The evidence cannot yet measure the guns’ share of the gap: the studies the RAND Corporation reviewed link more guns with more violent crime but cannot show which causes which.
Six common claims, against the evidence
Claim“The U.S. has a uniquely deadly gun violence problem”
Among its high-income peers, yesOn the Global Burden of Disease’s 2019 rates, the U.S. firearm death rate, 10.4 per 100,000, was nearly five times France’s, the next highest of twelve high-income peers.
Claim“The gap with other countries is mostly suicide”
Half and halfSuicides were 62% of U.S. gun deaths in 2024, but on the 2019 rates the gap with France, 8.2 per 100,000, was 4.1 of suicide and 3.8 of homicide.
Claim“Americans are just more violent; it isn’t the guns”
Mostly notIn 2024 the U.S. homicide rate without a gun was 1.4 per 100,000, against about 1.2 in Canada; with a gun it was 4.5, against 0.69. How much poverty and inequality add is unsettled.
Claim“It’s a mental health problem, not a gun problem”
The gun mattersThis page does not compare rates of mental illness. In a U.S. study, 89.6% of suicidal acts with a gun were fatal, against 8.5% of all acts. The Israeli army’s suicide rate fell 40% when soldiers had to leave guns on base at weekends.
Claim“Gun control doesn’t work, criminals don’t follow laws”
Partly trueNine in ten prisoners who had a gun during their offence did not get it from a shop (Bureau of Justice Statistics). But the RAND Corporation finds supportive or moderate evidence that child access prevention laws, minimum ages, waiting periods and background checks reduce some gun deaths.
Claim“Defensive gun use saves millions of lives”
UnknownCrime-survey estimates run from about 70,000 to 116,000 defensive uses a year, and a 1993 survey produced 2.2 to 2.5 million; the RAND Corporation calls figures that high implausible. None of these counts lives saved.
Download the conclusion
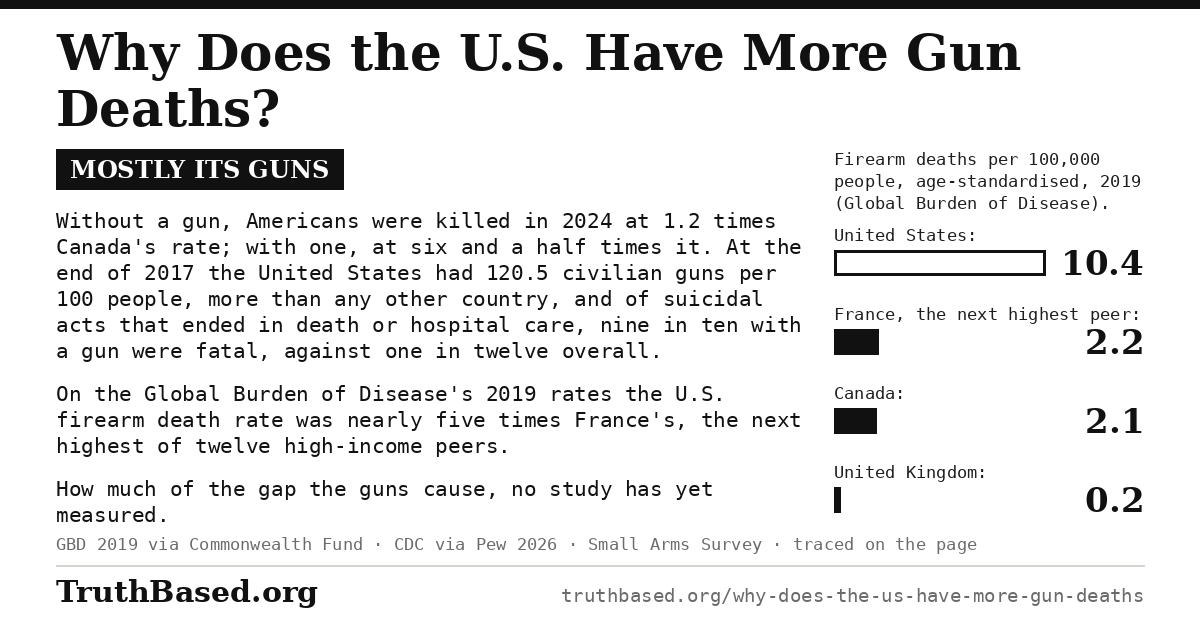
This card gives the answer, mostly its guns, and the reasons. In 2024 Americans were killed without a gun at 1.2 times Canada’s rate and with one at six and a half times. At the end of 2017 the country had 120.5 civilian guns per 100 people. And of suicidal acts that ended in death or hospital care, nine in ten with a gun were fatal, against one in twelve overall. Its bars are the 2019 firearm death rates of the United States, France, Canada and the United Kingdom. It is 1,200 by 630 pixels, the size social networks use for link previews, and anyone may download it and post it.
What would change this conclusion
This article concludes that:
- on the Global Burden of Disease’s 2019 rates the U.S. firearm death rate is nearly five times the next highest peer’s;
- the gap is about half suicide and half homicide;
- without a gun the U.S. homicide rate is close to Canada’s and under twice England and Wales’s, while with one it is many times theirs;
- a suicidal act with a gun ends in death far more often than one by any other means;
- keeping guns out of reach lowered total suicide in the Israeli army;
- more guns go with more gun deaths, but how much of the gap the guns cause has not been measured.
This would change if:
1. The Global Burden of Disease study or the World Health Organization revised its age-standardised firearm death rates so that the U.S. rate was less than twice the next highest peer’s.
2. Police-recorded data from Canada or England and Wales, or Centers for Disease Control and Prevention data, put the U.S. homicide rate without a gun at triple a peer’s or more.
3. A prospective study of a firearm restriction found total suicide unchanged after it, the fall in firearm suicide fully made up by other methods.
4. Studies that measured gun ownership directly and followed it over time found that homicide and suicide did not rise with it once other differences were accounted for.
Sources
CDC WONDER and National Vital Statistics System. Firearm mortality data. The origin of the U.S. counts and age-adjusted rates by intent used throughout, as compiled by Pew Research Center. wonder.cdc.gov
Pew Research Center. J. Gramlich, What the data says about gun deaths in the U.S., 28 April 2026. Source for the CDC counts for 2024 (the total of 44,447, 12.8 per 100,000, the third yearly fall in a row, and the homicides and suicides, with and without a gun), the 2024 gun suicide rate against the record of 1977, the FBI weapon types for 2024, the Gun Violence Archive’s count of mass shootings in 2024 and the small share of gun homicides that mass shootings make up, and the Global Burden of Disease rate for the United States in 2023. pewresearch.org
Commonwealth Fund. E. D. Gumas, M. Z. Gunja and R. D. Williams II, The Health Costs of Gun Violence: How the U.S. Compares to Other Countries, chartpack, April 2023. Source for the international table and chart: the Global Burden of Disease study’s age-standardised firearm death rates for 2019, in total and by homicide and suicide, for the United States and thirteen peer countries. commonwealthfund.org chartpack (PDF)
Small Arms Survey. A. Karp, Estimating Global Civilian-Held Firearms Numbers, briefing paper, June 2018, and its annexe, Civilian Firearms Holdings, 2017. Source for 120.5 civilian firearms per 100 residents in the United States at the end of 2017, Yemen’s 52.8, Canada’s 34.7, France’s and Germany’s 19.6, Switzerland’s 27.6, Japan’s fewer than one, the 393 million U.S. civilian firearms out of 857 million worldwide, and the 122 million acquired in 2006 to 2017. The annexe ranks all 230 countries and territories: the Falkland Islands’ 62.1 comes between the United States and Yemen, and Switzerland is 19th. The briefing paper linked is the copy filed with the Supreme Court in New York State Rifle & Pistol Association v. Bruen. supremecourt.gov smallarmssurvey.org (annexe)
Rockefeller Institute of Government, Regional Gun Violence Research Consortium. J. R. Silva, Public Mass Shootings Around the World: Prevalence, Context, and Prevention, 20 February 2024, and Introducing the Global Mass Shooting Factsheet, 22 June 2026. Source for the definition, the 109 public mass shootings in the United States and 35 in 35 comparable countries between 2000 and 2022, the 76% of incidents and 70% of deaths against a third of the population, and the countries with four or more. rockinst.org (2024) rockinst.org (2026)
Institute for Health Metrics and Evaluation. K. Leach-Kemon, R. Sirull and S. Glenn, On gun violence, the United States is an outlier, last updated 31 October 2023. Source for the age-adjusted firearm homicide comparisons for 2021: the U.S. rate 19 times France’s, 33 times Australia’s and 77 times Germany’s. healthdata.org
RAND Corporation. R. Smart, A. R. Morral, J. P. Murphy et al., The Science of Gun Policy, fifth edition, 29 January 2026, and RAND’s online summary, What Science Tells Us About the Effects of Gun Policies, updated the same day. Source for the evidence ratings in the policy table and the definitions of its tiers; RAND’s press release of the same day calls the fifth edition the final scheduled one. rand.org rand.org rand.org (press release)
RAND Corporation. R. Ramchand and J. Saunders, The Effects of the 1996 National Firearms Agreement in Australia on Suicide, Homicide, and Mass Shootings, updated 15 April 2021. Source for RAND’s judgement of the Australian studies: only one found convincing evidence of a change in firearm homicide, a fall in women killed, and the evidence is consistent with the reforms reducing firearm suicides, mass shootings and killings of women, with doubts remaining for suicide. rand.org
Lubin G, Werbeloff N, et al. Decrease in Suicide Rates After a Change of Policy Reducing Access to Firearms in Adolescents. Suicide and Life-Threatening Behavior, 2010. Source for the 40% fall in the Israel Defense Forces’ suicide rate, most of it in weekend firearm suicides, with no significant change on weekdays; the policy’s terms and year are as Harvard’s Means Matter bibliography summarises the study. doi.org hsph.harvard.edu
Chapman, Alpers and Jones. Association Between Gun Law Reforms and Intentional Firearm Deaths in Australia, 1979–2013. JAMA, 2016; Chapman, Alpers, Agho and Jones. Australia’s 1996 gun law reforms: faster falls in firearm deaths, firearm suicides, and a decade without mass shootings. Injury Prevention, 2006. Source for the 13 fatal mass shootings of five or more killed in 1979 to 1996 and none from 1997 to May 2016, the faster falls in firearm deaths and firearm suicides, and the 2016 study’s finding that suicides and homicides by other means fell by more, so that it was not possible to determine whether the change in firearm deaths could be attributed to the reforms. The University of Sydney’s release of 23 June 2016, linked below, is the source for the killing of 35 people at Port Arthur, Tasmania, in April 1996. doi.org (2016) doi.org (2006) sydney.edu.au
Leigh A and Neill C. Do Gun Buybacks Save Lives? Evidence from Panel Data. American Law and Economics Review, 2010. Source for the buyback removing about 20% of the civilian stock, more than 650,000 firearms; the fall in firearm suicides with no significant effect on death rates by other means; and the effect on firearm homicide, similar in size but less precise. openresearch-repository.anu.edu.au
Conner, Azrael and Miller. Suicide Case-Fatality Rates in the United States, 2007 to 2014. Annals of Internal Medicine, 2019. Source for the 89.6% case fatality of suicidal acts with a firearm, 8.5% overall, and drug poisoning’s 59.4% of acts and 13.5% of deaths; the case fatality rates count acts that ended in death or in emergency or hospital care. doi.org
Harvard T.H. Chan School of Public Health, Means Matter. Duration of Suicidal Crises. Source for the acute period of heightened suicide risk being often only minutes or hours long, which Means Matter cites to Hawton (2007). hsph.harvard.edu
Pew Research Center. Key facts about Americans and guns, July 2024. Source for the 32% of adults who own a gun and the four in ten who live in a household with one (June 2023 survey), little changed since 2017. pewresearch.org
Campbell et al. Risk Factors for Femicide in Abusive Relationships: Results From a Multisite Case Control Study. American Journal of Public Health, 2003. Source for the 11 cities, the comparison of 220 women killed by a partner with 343 abused women, and the more-than-fivefold risk when an abuser has access to a gun: an adjusted odds ratio of 5.44, which the paper calls a 5-fold increase once the characteristics of the abuse are considered. pubmed.ncbi.nlm.nih.gov pmc.ncbi.nlm.nih.gov
The Trace. J. Mascia, How Often Are Guns Used for Self-Defense?, 3 June 2022. Source for the crime survey’s average of 70,040 defensive gun uses a year in 2014 to 2018, and researchers and gun-rights advocates citing different data. thetrace.org
Kleck G and Gertz M. Armed Resistance to Crime: The Prevalence and Nature of Self-Defense with a Gun. Journal of Criminal Law and Criminology, 1995. Source for the survey’s interviews, from February to April 1993, and its estimate of about 2.2 to 2.5 million defensive gun uses a year by civilians, from a one-year recall period. scholarlycommons.law.northwestern.edu
RAND Corporation. The Challenges of Defining and Measuring Defensive Gun Use; The Relationship Between Firearm Prevalence and Violent Crime; The Relationship Between Firearm Availability and Suicide; all 2 March 2018. Source for the crime survey estimate of 116,000 defensive gun uses a year, which RAND says almost certainly underestimates the true number, and its judgement that high-end estimates such as 2.5 million are not plausible; for four of six newer studies finding more guns associated with more homicide, while their methods cannot show that the guns cause it; and for the evidence on suicide being consistent with guns raising the risk. rand.org rand.org rand.org
Statistics Canada. Homicide in Canada, 2024, infographic 11-627-M, 2 December 2025; Firearms and violent crime in Canada, 2024, Juristat, released 21 April 2026. Source for 788 homicides in 2024, the rate of 1.91 per 100,000, the 287 in which a firearm was used, and the shooting-homicide rate of 0.69 per 100,000. statcan.gc.ca statcan.gc.ca (The Daily)
Office for National Statistics. Homicide in England and Wales: year ending March 2025, 5 February 2026. Source for 8.6 homicides per million people, the lowest rate since 1977, and the 32 homicides by shooting, 6% of all homicides, from the Home Office’s Homicide Index. ons.gov.uk
U.S. Census Bureau. National Population Totals and Components of Change: 2020-2025, Vintage 2025. Source for the 1 July 2024 resident population of 340,003,797, the denominator of the U.S. crude rates in the homicide table. census.gov
Bureau of Justice Statistics. M. Alper and L. Glaze, Source and Use of Firearms Involved in Crimes: Survey of Prison Inmates, 2016, NCJ 251776, January 2019. Source for the 287,400 prisoners who possessed a firearm during their offence and where they got it: 43% off the street or the underground market, 6% stolen, 7% found at the scene, 25% from family, a friend or as a gift, 7% under their own name from a licensed dealer, 0.8% at a gun show, 90% not from a retail source. bjs.ojp.gov
Braga AA, Weisburd D and Turchan B. Focused deterrence strategies effects on crime: A systematic review. Campbell Systematic Reviews, 2019. Source for the 24 quasi-experimental evaluations, none a randomised trial, the moderate and statistically significant overall crime reduction, the smaller effects in the more rigorous designs, and the strategy’s focus on the small groups responsible for a disproportionate share of crime. pmc.ncbi.nlm.nih.gov
Supreme Court of the United States. New York State Rifle & Pistol Association v. Bruen, 597 U.S. 1 (2022), syllabus. Source for the holding that the Second and Fourteenth Amendments protect carrying a handgun in public for self-defence, for the summary of Heller (2008) and McDonald (2010) as protecting an individual right to keep and bear arms for self-defence, and for the test that a regulation must be consistent with the nation’s historical tradition of firearm regulation. supremecourt.gov
Cite this article
TruthBased.org. “Why Does the U.S. Have More Gun Deaths?” Updated October 2026. https://www.truthbased.org/why-does-the-us-have-more-gun-deaths