Religion & Society
Does Religion Cause Violence?
Sometimes, but rarely on its own: wars, terrorism, sectarian conflicts and old death tolls against the evidence.
Crime & Justice
Why Does the U.S. Have More Gun Deaths?
Firearm deaths per 100,000 in the U.S. and twelve peers, split into homicide and suicide, and why the gap is a gun gap.
Crime & Justice
Did Police Funding Cuts Cause the 2020 Crime Surge?
Firearm homicides rose about 35% in 2020. Whether defunding police was the cause, on CDC mortality data, FBI figures and the quasi-experimental studies.
Which Side Commits More Political Violence?
Counted by deaths, right-wing attackers are ahead of left-wing ones in every count here over a decade or more. In 2025 the left led in CSIS’s count, by attacks and plots and by deaths. What each count includes, and the filing choices that move it.
Jump to the verdict ↓
The short answer
Mostly the right. Over a decade or more, right-wing attackers have killed more people than left-wing ones in every count on this page that sorts deaths by side, usually several times more. In 2025 the left pulled ahead in CSIS’s count, with 16 attacks and plots to the right’s 10, the first time in more than 30 years, and six deaths to two; in the first half of 2026 the right led again. And if 9/11 is counted, Islamist attackers account for most of the dead.
What each database counts
The figures in this article come from databases that count different things by different rules.
| Database | What it counts | What it leaves out |
|---|---|---|
| FBI hate crime statistics | Crimes police record as motivated by bias; reporting is voluntary, but most agencies do it | Crimes never reported, or not recorded as hate crimes |
| New America | People killed in US terrorist attacks since 9/11, by the attackers’ ideology | 9/11 itself and everything before it |
| CSIS (Center for Strategic and International Studies) | Terrorist attacks and plots since 1994, stopped plots included | Violence without a political aim |
| ADL (Anti-Defamation League) | Killings by people with extremist ties, ideological or not | Injuries |
| ACLED (Armed Conflict Location and Event Data) | Protests, riots and political violence since 2020, from news and other reports | Violence with personal or purely criminal motives |
New America, CSIS, ADL, the Government Accountability Office (GAO) and the Cato Institute all count Islamist or jihadist attacks as a category of their own. Their far right means white supremacist, anti-government and anti-abortion violence; their far left, anarchist, communist, animal-rights and environmental violence. Two filings differ. New America counts “ideological misogyny” and Black separatist or nationalist attacks separately, while CSIS and Cato put misogynist and incel attacks on the right and CSIS puts Black nationalist attacks on the left. Researchers at George Washington University’s Program on Extremism call jihadists “extreme right-wing actors”, but no database here files them on the right, and neither does this article, which uses the databases’ own categories.
The 9/11 Problem
The September 11 attacks killed 2,977 people in one day, about 21 times the 142 that New America counts killed by far-right attackers in the years since. Counted in, 9/11 swamps everything else. New America’s count starts after it, and the Cato Institute gives its totals both with and without it.
The far right
Since 9/11, far-right attackers have killed the most people in most of these counts, narrowly in New America’s, while GAO’s count to 2016 goes the other way.
Three counts
Years differ by row
New America: people killed by far-right attackers since 9/11; 159 adding its 17 “ideological misogyny” deaths, which Cato files on the right
142 deaths
ADL: right-wing extremists’ share of the 443 killings by extremists it counted from 2012 to 2021 (333)
75%
GAO (2017), from the US Extremist Crime Database: far-right share of 85 deadly attacks, 12 September 2001 to 2016 (62); by deaths radical Islamist attacks led, 119 to 106, 49 of the 119 at Orlando’s Pulse nightclub in 2016
73% of attacks
How to read it: each bar is the number of people killed in the United States since 9/11, to July 2026, by attackers of one ideology, in New America’s categories and labels; 9/11’s own 2,977 dead are not counted. The second bar is 142 plus 17, on the Cato Institute’s filing of misogynist and incel attacks. Source: New America, Terrorism in America After 9/11.
| Category | People killed |
|---|---|
| Far right | 142 |
| Far right plus ideological misogyny (Cato’s filing) | 159 |
| Jihadists | 122 |
| Ideological misogyny | 17 |
| Black separatist/nationalist | 13 |
| Far left | 3 |
ADL counted 47 to 79 killings by extremists a year in 2015 to 2019 and 13 in 2024, the third fall in a row; it recorded no extremist-related mass shooting that year. Every killing it counted in 2022, 2023 and 2024 was by right-wing extremists.
| Attack | Year | Attacker and motive | Deaths |
|---|---|---|---|
| Oklahoma City bombing | 1995 | Timothy McVeigh, anti-government | 168 |
| Oak Creek Sikh temple | 2012 | Wade Michael Page, neo-Nazi | 7 |
| Charleston church | 2015 | Dylann Roof, white supremacist, targeting Black worshippers | 9 |
| Pittsburgh synagogue | 2018 | Robert Bowers, antisemitic | 11 |
| El Paso Walmart | 2019 | Patrick Crusius, anti-Hispanic white nationalist | 23 |
| Buffalo supermarket | 2022 | Payton Gendron, white supremacist, targeting Black shoppers | 10 |
Argument
The columnist Megan McArdle argued in the Washington Post in 2022 that the far-right count is padded with crimes that were not political, since most incidents in ADL’s 2021 report were domestic violence, custody disputes and prison-gang crime.
Assessment
ADL does count such killings. Of the 443 in its ten years to 2021, 212 were not classed as ideological, yet counting only the ideological ones, right-wing extremists still killed the most, 122 against 87 by domestic Islamists and 18 by the left. Cato, which leaves out non-political and prison-gang killings, also puts right-wing attackers first once 9/11 and Oklahoma City are set aside.
Argument
Closer watching of the far right turns up more of its plots and makes more arrests, so its counts rise with the attention.
Assessment
That moves counts of plots and arrests, not counts of the dead, and the comparison here is of deaths. The Justice Department’s publicity leaned the other way; the sociologist Charles Kurzman found its press releases named two-thirds of Muslim Americans involved in violent plots, and a study he cited found they named a quarter of right-wing defendants.
The far left
Far-left attackers have killed fewer people in the United States since 9/11 than far-right or jihadist ones; New America counts three far-left deaths in that time. CSIS, a Washington think tank that also counts foiled plots and files Black nationalism under the left, shows how much the span of years matters.
How to read them: the first chart counts attacks and plots from 2016 to 4 July 2025; the second, the people killed by each side’s attacks over the past decade to that date. Red is right-wing, green left-wing.
| Measure | Right-wing | Left-wing |
|---|---|---|
| Attacks and plots, 2016 to 4 July 2025 | 152 | 41 |
| People killed, past decade to July 2025 | 112 | 13 |
Source: CSIS’s brief of 25 September 2025; the 152 is Axios’s count from CSIS’s data. Jihadist attacks killed 82 over the decade; the brief’s text gives no matching count of their attacks and plots.
In 2025 CSIS counted 16 left-wing attacks and plots against 10 right-wing, which it called the first time in more than 30 years the left was ahead. Left-wing attacks killed six people that year, Charlie Kirk among them, and right-wing attacks two. CSIS cautions that the gap rests on small counts, and in the first half of 2026 the right led again, five attacks and plots to one.
2020 demonstrations (ACLED and Princeton)
24 May to 22 August 2020
All demonstrations
10,600+
Peaceful
10,100+, nearly 95%
Violent
fewer than 570, about 5%
Linked to Black Lives Matter (BLM), from 26 May
7,750+, more than 93% without violence or destruction
ACLED counts a demonstration as violent when demonstrators clash, loot, block roads or damage property, even if police started it. In Minneapolis and Saint Paul alone, owners and insurance experts estimated the damage could top $500 million, the Star Tribune reported in June 2020. CSIS says most protests, looting and unrest are not terrorism, because some are not violent and others lack a political motive; it did count attacks such as the burning of Minneapolis’s Third Precinct police station.
In the past decade 20 of CSIS’s 35 left-wing attacks used arson or incendiaries; CSIS left out the 2025 attacks on Teslas as vandalism. Ten of the 13 people killed by left-wing attacks over the decade were police officers shot in ambushes.
Progressive
Counting property damage as terrorism inflates the far left. By 2004 the FBI counted more than 1,100 criminal acts since 1976 by the Earth and Animal Liberation Fronts and related groups, arson the most destructive, under a stated philosophy that discourages harming “any animal, human and nonhuman”, which the FBI said they generally kept, though it reported an escalation in violent rhetoric and tactics from 2002.
Conservative
“93% peaceful” hides the harm. Hundreds of demonstrations turned violent, and the damage in the Twin Cities alone was estimated at hundreds of millions of dollars.
Answer
Both are real, and neither moves the databases’ death counts, where the right leads 142 to 3 since 9/11 in New America’s and 112 to 13 over the past decade in CSIS’s.
Download this conclusion: a year against a decade
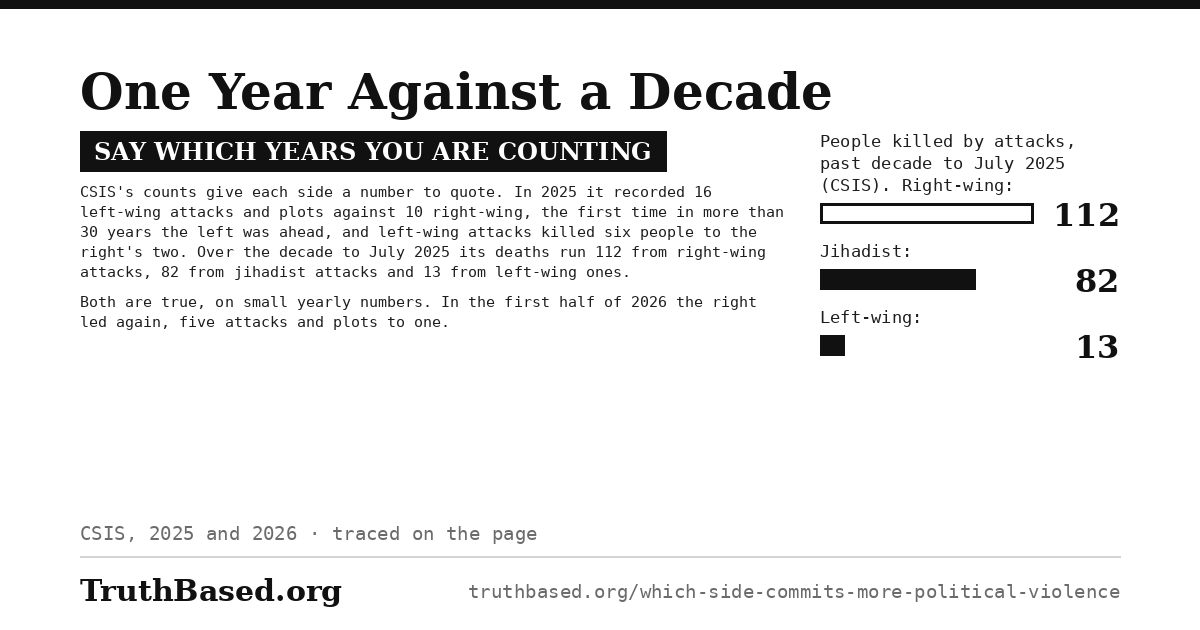
This section as one image: the people killed by right-wing, jihadist and left-wing attacks over the decade to July 2025, 112, 82 and 13, beside CSIS’s counts for 2025, when the left led by attacks and plots and by deaths, and for the first half of 2026, when the right led again.
Religious violence
New America files attacks by the attacker’s cause, and counts deaths caused by jihadists. Charles Kurzman of the University of North Carolina counts Muslim Americans involved in violent extremism, a rule set by who the attacker is as well as what they did.
Deaths in the US from jihadist and Muslim-American extremist attacks
Since 12 September 2001
Killed by jihadists (New America, to July 2026)
122 deaths
Killed in Muslim-American violent extremism (Kurzman, to 2025), against all murder victims in the US (FBI counts to September 2025)
159 against 399,067
Those deaths as a share of all murders
0.04%
9/11 itself, counted in neither
2,977 deaths
The databases put violence against abortion providers on the right. New America counts anti-abortion violence as far-right terrorism, and CSIS counts opposition to abortion as a right-wing motive. As with New America’s jihadist count, the count follows the attacker’s cause, not their religion.
Crimes against abortion providers, patients and volunteers, US, Canada and, for 2013 to 2015, Colombia (National Abortion Federation)
1977 to 2024
Murders
11
Attempted murders
26
Bombings
42
Arsons
203, and 4 more in 2025
The National Abortion Federation is the professional association of abortion providers, and these are its own totals.
Eric Rudolph, who pleaded guilty in 2005, bombed the 1996 Atlanta Olympics, two clinics that performed abortions and a gay nightclub, killing a spectator and a police officer. His statement blamed legal abortion, and he had claimed two of the Atlanta bombings in letters signed “Army of God”, the name of an underground anti-abortion group. Scott Roeder shot Dr. George Tiller dead in Tiller’s Wichita church in 2009 to stop him performing abortions, and testified that his conversion to Christianity had led him to oppose abortion.
Jewish extremist violenceThe FBI suspected members of the Jewish Defense League of a series of bombings in 1985, including the one that killed Alex Odeh, an Arab-American civil rights organizer, at his office in Santa Ana; no one has been convicted. In 2001 the group’s leader, Irv Rubin, and Earl Krugel were arrested for plotting to bomb a mosque in Culver City and a congressman’s office; Krugel pleaded guilty.
Hate crime counts record the target
Hate crime statistics measure something different. The FBI counts an offense as a hate crime when police find it was motivated by bias against race, ethnicity, religion, disability, sexual orientation, gender or gender identity. Politics is not one of those categories, so the count records who was targeted and says nothing about which side the attacker was on.
The count is also a floor. Not every agency reports: 16,791 took part in 2025, covering 95.3% of the population. The Bureau of Justice Statistics’ victim survey, which counts crimes whether or not anyone told the police, found about 246,900 hate crime victimizations a year from 2005 to 2019. The FBI recorded 7,314 hate crime incidents in 2019.
FBI hate crime statistics, 2025
released 14 August 2026
Incidents reported (2024: 11,679)
10,881
Race, ethnicity or ancestry bias
55.6% of single-bias victims
Religion bias
22.9%
Sexual orientation bias
14.5%
Gender identity bias
4.6%
How to read it: each bar is the number of hate crime incidents reported to the FBI in 2025 with that single bias; taller means more incidents reported, not necessarily more committed.
| Bias | Incidents |
|---|---|
| Race, ethnicity or ancestry | 5,859 |
| Religion | 2,408 |
| Sexual orientation | 1,527 |
| Gender identity | 489 |
| Disability | 145 |
| Gender | 100 |
Source: FBI hate crime statistics for 2025, as compiled from the FBI Crime Data Explorer by the Arab American Institute (table updated 17 August 2026). The six rows sum to 10,528; another 353 incidents had more than one bias, making 10,881 in all. The total fell about 7% from 2024 and, by the Institute’s count, is the lowest in five years, while anti-Latino incidents rose to 1,002, the most ever recorded for that category.
Anti-Jewish incidents show why the target does not settle the side. In the Institute’s compilation they were 1,528 of the 2,408 religion-based incidents in 2025, 63%. The Poway synagogue gunman in 2019 was a white supremacist who wanted to kill Jews and Muslims. The two who attacked a kosher market in Jersey City the same year had shown interest in the Black Hebrew Israelites, and New Jersey’s attorney general said they hated Jews and the police. A count by target puts both attacks under anti-Jewish bias.
Download this conclusion: hate crime in 2025
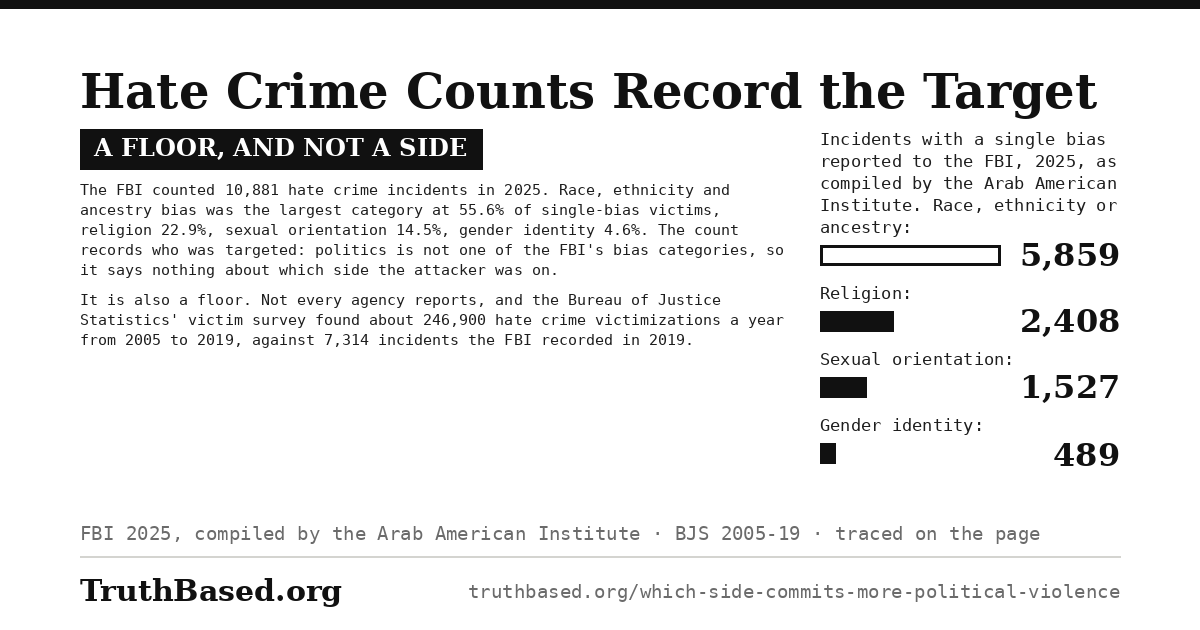
This section as one image: what the FBI’s 2025 release counted by bias, why a count by target cannot say which side the attacker was on, and the victim survey that shows how much the police count misses.
The last few years against the long run
Cato’s counts of killings, 1975 to 2025
The Cato Institute counts people murdered in politically motivated attacks on US soil since 1975. Its September 2025 count, published the day after the killing of Charlie Kirk and covering 1 January 1975 to 10 September 2025, put right-wing attackers at 391 deaths and left-wing attackers at 65; with 9/11 set aside, that is 63% of deaths against 10%. Only 79 of its 3,597 deaths came from 2020 on, about 0.07% of all murders in those years. Of those 79, over half were attributed to right-wing attackers, 22% to left-wing and 21% to Islamist ones.
Cato’s fuller 2026 analysis, to the end of 2025, puts the totals at 363 right-wing and 68 left-wing. Once 9/11 and Oklahoma City are set aside, the remaining 430 murders split 45% right-wing, 32% Islamist and 16% left-wing, and its test finds no statistically significant rise in deadly attacks over the 51 years.
So once 9/11 is set aside, the right-wing share is the largest in each of these counts, and the left-wing share since 2020 is about twice the 10% it had over the whole period. Cato warns that the numbers are so small that a single attack could reverse the shares; split into 17 three-year periods outside 9/11 and Oklahoma City, its count has left-wing attackers the deadliest in three. CSIS’s count of attacks and plots shows the same shift, with left-wing ones outnumbering right-wing ones in 2025 for the first time in more than 30 years, from a very low base.
| Figures | Misread on the right | Misread on the left |
|---|---|---|
| Far-right killings | Treating the counts of right-wing killings as biased wholesale, instead of disputing particular cases | Quoting the far-right share of deaths without saying 9/11 is left out; with it counted, Islamist attackers account for 87% of deaths in Cato’s count |
| Far-left violence | Calling the Insurance Information Institute’s estimate of $1 billion to $2 billion in claims from two weeks of unrest in 2020 damage done by BLM or antifa; the estimate attributes it to no one | “93% of BLM protests were peaceful”, used to wave away the violent minority and the damage it did |
| Islamist violence | Counting 9/11 in a long-run total as if attacks on that scale recur; citing Islamist deaths abroad as evidence about American Muslims | Treating Kurzman’s count, 0.04% of all murders, as proof that there is no risk of a mass-casualty attack by foreign networks |
The verdict: what the evidence shows
Counted by deaths, the answer is the right, and not narrowly. Over the decade to July 2025, CSIS counts 112 people killed in right-wing attacks and 13 in left-wing ones. Across 1975 to 2025, the Cato Institute puts 10% of the deaths from political attacks on right-wing attackers and 2% on left-wing ones, and 45% against 16% once 9/11 and Oklahoma City are set aside. Every count on this page that sorts deaths by side over a decade or more puts the right ahead of the left.
In 2025 the pattern broke. CSIS recorded 16 left-wing attacks and plots against 10 right-wing, the first time in more than 30 years that the left was ahead, as right-wing incidents fell and left-wing ones rose from a low base. Left-wing attacks killed six people that year and right-wing ones two. It is a real change, on small numbers, and it has not lasted so far; in the first half of 2026 CSIS counts five right-wing attacks and plots against one left-wing. Two filing choices move the totals without changing the order between left and right: where incel attacks go, and whether 9/11 is counted. Counted in, 9/11 makes Islamist attackers the deadliest of all, with 87% of the deaths in Cato’s count since 1975.
Four common claims, against the evidence
Claim“Most political violence comes from the right.”
True of deathsRight-wing attacks killed 112 people over the decade to July 2025 in CSIS’s count, left-wing ones 13. Cato’s count since 1975, leaving out 9/11 and Oklahoma City, gives right-wing attackers 45% of the murders and left-wing ones 16%.
Claim“The left is now the bigger threat.”
Only in 2025In 2025 CSIS counted 16 left-wing attacks and plots to 10 right-wing, the first time in more than 30 years the left led, and six deaths to two. Over the decade to July 2025 the left was far behind in deaths, 13 to 112, and in the first half of 2026 the right led again.
Claim“Counting 9/11 changes the answer.”
Not between left and rightThe 9/11 attackers were neither. Counted in, they make Islamist attackers the deadliest, 87% of the deaths in Cato’s count since 1975; left out, the right leads.
Claim“The counts are padded with killings that were not political.”
True of one countADL counts killings by extremists whether or not they were political. Cato counts only politically motivated murders, and it too puts right-wing attackers first once 9/11 and Oklahoma City are set aside.
Download the conclusion
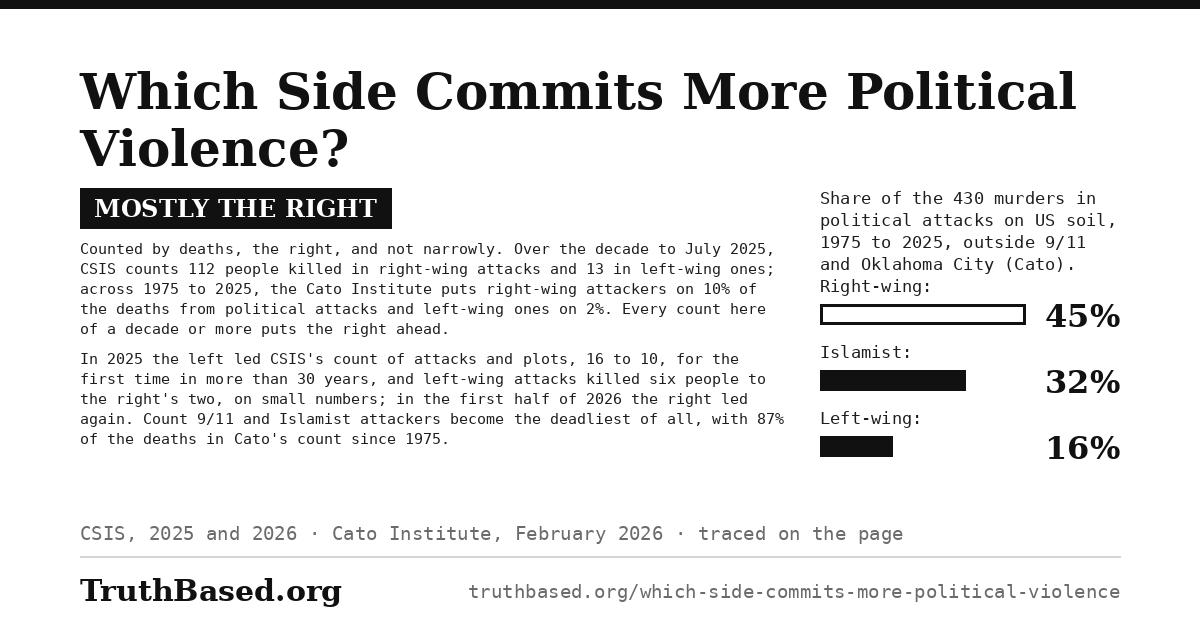
The verdict above as one image, with the Cato Institute’s split of the 430 people murdered in political attacks on US soil from 1975 to 2025, outside 9/11 and Oklahoma City, as its chart: 45% by right-wing attackers, 32% by Islamist and 16% by left-wing. It is 1,200 by 630 pixels, the size social networks use for link previews, and anyone may download it and post it.
What would change this conclusion
This article concludes that: (1) right-wing attackers have killed more people in the United States than left-wing ones in every count here that sorts deaths by side over a decade or more; (2) in 2025 left-wing attacks and plots outnumbered right-wing ones, the first time in more than 30 years, and left-wing attacks killed more people, on small numbers; (3) counting 9/11 makes Islamist attackers the deadliest without changing the order between left and right.
These conclusions would be falsified by:
• A count of deaths over a decade or more in which left-wing attackers killed more people than right-wing ones
• Counts for later years showing left-wing attacks and plots, and deaths, back ahead of right-wing ones and staying there, which would make 2025 the start of a trend
• A refiling of disputed cases large enough to close the gaps in deaths, since the counts do not always file the same attack the same way
Sources
CSIS (Daniel Byman and Riley McCabe), Left-Wing Terrorism and Political Violence in the United States: What the Data Tells Us, 25 September 2025. Source for 2025 being the first time in more than 30 years that left-wing attacks and plots outnumbered right-wing ones; the 13, 112 and 82 people killed by left-wing, right-wing and jihadist attacks over the decade to July 2025; the 41 left-wing attacks and plots since 2016; the 20 of 35 left-wing attacks in the decade that used arson or incendiaries, the attacks on Teslas left out as vandalism, and the 10 of the 13 left-wing victims who were police officers; and CSIS’s filing of misogynist, incel and anti-abortion attacks on the right and Black nationalist ones on the left. csis.org
CSIS, US Terrorism Incidents Dataset (version 260904, 4 September 2026, covering 1 January 2023 to 30 June 2026); CSIS, Global Terrorism Threat Assessment 2026, May 2026; and Axios, 28 September 2025. The dataset is the source for the 16 left-wing and 10 right-wing attacks and plots in 2025 and the six and two people they killed, and for the five right-wing attacks and plots against one left-wing in the first half of 2026; its method notes say figures in CSIS’s earlier analyses may not be replicable with this version. The threat assessment is the source for CSIS’s caution that the 2025 gap rests on small counts. The 152 right-wing attacks and plots from 2016 to 4 July 2025 is Axios’s count from CSIS’s data, not a figure in the brief’s text. csis.org (dataset) csis.org (2026 assessment) axios.com
CSIS, The War Comes Home: The Evolution of Domestic Terrorism in the United States, 22 October 2020, and The Escalating Terrorism Problem in the United States, June 2020. Source for what CSIS counts and leaves out (most protests, looting and unrest) and for its definitions of left-wing and right-wing terrorism. csis.org (2020) csis.org (June 2020)
Cato Institute (Alex Nowrasteh), Politically Motivated Violence Is Rare in the United States, 11 September 2025, as corrected on 18 September 2025, and Politically Motivated Killers: 51 Years of Terrorist Murders on US Soil, 1975–2025, Policy Analysis No. 1012, 19 February 2026. Source for the 391 and 65 deaths to 10 September 2025 and the 79 deaths since 2020 with their split; the 363 and 68 deaths to the end of 2025; the 45%, 32% and 16% of the 430 murders outside 9/11 and Oklahoma City; the 10%, 2% and 87% of all deaths since 1975; its 17 three-year periods, in three of which left-wing attackers were the deadliest, and its test for a trend in deadly attacks; and Cato’s filing of incel attacks on the right. cato.org (2025) cato.org (2026) alexnowrasteh.com (2025)
New America, Terrorism in America After 9/11, What Is the Threat to the United States Today? Source for the people killed in the United States since 9/11 by attackers of each ideology, in the report’s table updated 16 July 2026: far right 142, jihadist 122, ideological misogyny 17, Black separatist or nationalist 13, far left 3. The report’s text, not updated since it was published on 10 September 2021, gives earlier totals; its editor’s note sends readers to the figures. newamerica.org
ADL Center on Extremism, Murder and Extremism in the United States, the reports on 2021 to 2024; ADL’s press release on the 2021 report, 15 February 2022; and ADL’s letter to the Washington Post, 2022. ADL counts killings by people with extremist ties whether or not the killing was ideological. Source for the 13 killings of 2024, every killing of 2022, 2023 and 2024 being by right-wing extremists, the 47 to 79 a year in 2015 to 2019, the 333 of 443 (75%) over 2012 to 2021, the 212 of those not classed as ideological, and the 122, 87 and 18 ideological killings by right-wing, domestic Islamist and left-wing extremists. adl.org (2024 report) adl.org.il (2021 release) adl.org (letter)
GAO-17-300, Countering Violent Extremism: Actions Needed to Define Strategy and Assess Progress of Federal Efforts, April 2017. Pages 3 to 5 and appendix II, from the US Extremist Crime Database: 85 deadly attacks from 12 September 2001 to 31 December 2016, 62 (73%) by far-right and 23 (27%) by radical Islamist attackers; 106 and 119 deaths; 41% of the Islamist deaths at Pulse. gao.gov
National September 11 Memorial & Museum, backgrounder, 2023. Source for the 2,977 people killed on 11 September 2001. 911memorial.org
Records of the six attacks in part 2. The FBI on the Oklahoma City bombing (168 killed); the Governor of Wisconsin’s proclamation of 5 August 2025 on the Oak Creek Sikh temple shooting (7), and GAO’s appendix II on its gunman; the US Attorney’s Office for South Carolina and the Fourth Circuit’s ruling of 25 August 2021 on Charleston; the Associated Press on Pittsburgh; the Department of Justice on El Paso; the Second Circuit’s ruling of 27 July 2026, ABC News and the New York Attorney General’s report of 18 October 2022 on Buffalo. fbi.gov evers.wi.gov justice.gov (Charleston) ca4.uscourts.gov AP via wxyz.com justice.gov (El Paso) reason.com abcnews.com ag.ny.gov
George Washington University Program on Extremism, Rise of the Reactionaries. Source for its description of jihadists as extreme right-wing actors. extremism.gwu.edu
Megan McArdle’s Washington Post column of 23 May 2022, as quoted by Fox News, with ADL’s reply above. Source for the objection in part 2 that the far-right count is padded with crimes that were not political. foxnews.com
Charles Kurzman (University of North Carolina), Muslim-American Involvement with Violent Extremism, annual report, data updated 9 January 2026, and The Privacy Rights of Terrorism Defendants, Muslim and Non-Muslim, Lawfare, 5 April 2019. Source for the 159 deaths against 399,067 murder victims to September 2025, and for the Justice Department’s press releases naming two-thirds of Muslim Americans involved in violent plots, against a quarter of right-wing defendants in a study by the Intercept that Kurzman cites. kurzman.unc.edu lawfaremedia.org
ACLED and Princeton’s Bridging Divides Initiative (Roudabeh Kishi and Sam Jones), Demonstrations and Political Violence in America: New Data for Summer 2020, 3 September 2020, and ACLED’s US methodology, 2020, and its page on US scope and coverage. Source for the 10,600+ demonstrations from 24 May to 22 August 2020, more than 10,100 of them peaceful and fewer than 570 violent, the 7,750+ linked to Black Lives Matter with more than 93% free of violence or destruction, what ACLED counts as violent, and what its US data cover from 2020 and leave out. acleddata.com acleddata.com (methodology) acleddata.com (scope)
Star Tribune, June 2020. Source for the estimate by owners and insurance experts that the damage in Minneapolis and Saint Paul could top $500 million. startribune.com
Axios, 16 September 2020, as reported by Fox Business the same day. Source for the Insurance Information Institute’s estimate, from Property Claim Services and other data, that the insured damage from the unrest of 26 May to 8 June 2020 would be $1 billion to $2 billion, the costliest in insurance history. axios.com foxbusiness.com
FBI, testimony of John E. Lewis to the Senate Judiciary Committee, 18 May 2004, and to the Senate Environment and Public Works Committee, 2005. Source for the more than 1,100 criminal acts since 1976 by the Earth and Animal Liberation Fronts and related groups, arson the most destructive, and their stated philosophy and its escalation from 2002. judiciary.senate.gov epw.senate.gov
National Abortion Federation: its safety and security page; its reports on 2022, 11 May 2023, on 2023 and 2024, 23 April 2025, and on 2025, 14 May 2026; and its statistics for 2015. The professional association of abortion providers, and these are its own totals since 1977: 11 murders and 26 attempted murders (the safety page), 42 bombings (the report on 2022), 203 arsons to 2024 (the report on 2023 and 2024) and 4 arsons in 2025. Its statistics cover the US and Canada, and Colombia from 2013 to 2015 (the statistics for 2015). prochoice.org (2023 and 2024) nationalabortionfederation.org (safety) nationalabortionfederation.org (2022) nationalabortionfederation.org (2015) nationalabortionfederation.org (2025)
Records of the cases in part 4. The Department of Justice, 8 April 2005, on Eric Rudolph’s plea agreement; NPR, 14 April 2005, with his statement; the ABA Journal, April 2025, on his plea, the nightclub and his Army of God letters; the Southern Poverty Law Center, 27 July 2005, on the two clinics; CNN, 18 March 2002, on the Army of God; the Kansas Supreme Court, State v. Roeder, 24 October 2014; UPI, 25 June 1988, on the FBI’s suspicions in the 1985 bombings; the FBI, 10 October 2025, and Al Jazeera, 17 May 2022, on the killing of Alex Odeh; the US Attorney’s Office for the Central District of California, 2005, on the Jewish Defense League plot. justice.gov (Rudolph) npr.org abajournal.com splcenter.org cnn.com kscourts.gov upi.com fbi.gov (Odeh) justice.gov (JDL) aljazeera.com
FBI hate crime statistics for 2025, released 14 August 2026: the FBI’s press release and the Department of Justice’s summary; the category counts as compiled from the Crime Data Explorer by the Arab American Institute (table updated 17 August 2026); ADL’s release of 17 August 2026; and the FBI’s definition of a hate crime. Source for the 16,791 agencies covering 95.3% of the population; the 10,881 incidents (11,679 in 2024) and the shares of single-bias victims; the counts by bias, the 353 multiple-bias incidents, the five-year low and the anti-Latino record; the 1,528 anti-Jewish incidents of 2,408 religion-based; and the bias categories the FBI counts. fbi.gov (release) justice.gov aaiusa.org adl.org fbi.gov (definition)
Congressional Research Service, report R46318, on the FBI’s collection of hate crime data. Source for the reporting being voluntary and for what the FBI’s figures cover. congress.gov
Bureau of Justice Statistics, Hate Crime Victimization, 2005–2019, September 2021, and its press release. Source for the 246,900 hate crime victimizations a year and the 7,314 incidents the FBI recorded in 2019. bjs.ojp.gov bjs.ojp.gov (release)
Records of the Poway and Jersey City attacks. The Department of Justice on John Earnest’s guilty plea and sentence; CNN, 30 September 2021, on his state sentencing; the Associated Press and CNN, 12 December 2019, on the New Jersey attorney general’s findings on the Jersey City attackers. justice.gov (plea) justice.gov (sentence) cnn.com (2021) AP via concordmonitor.com cnn.com
Cite this article
TruthBased.org. “Which Side Commits More Political Violence?” Published March 2026. https://www.truthbased.org/which-side-commits-more-political-violence