Crime & Justice
Why Does the U.S. Have More Gun Deaths?
Firearm deaths per 100,000 in the U.S. and twelve peers, split into homicide and suicide, and why the gap is a gun gap.
Crime & Justice
Which Side Commits More Political Violence?
Deaths and attacks by side in the counts of CSIS, Cato, New America and ADL, and what moves the totals.
Did Police Funding Cuts Cause the 2020 Crime Surge?
Firearm homicides rose about 35% in 2020 and peaked in 2021. The claim that "defund the police" caused this is widespread. The data point to a more complicated explanation involving a pandemic, a historic gun-buying surge, and real uncertainty about cause and effect.
Jump to the verdict ↓
The short answer
No. The budget cuts mostly did not happen. A pullback in policing did, and that is a different claim from the one people make.
The 2020 Homicide Spike: What the Data Actually Shows
The 2020 homicide increase is one of the most thoroughly confirmed events in modern crime statistics. It shows up in two independent measurement systems that share no common data pipeline: police-recorded homicide counts (FBI UCR) and death-certificate mortality data (CDC/NCHS). When two separate systems using different methods agree, the signal is real.
Firearm Homicide Mortality (CDC/NCHS)
2019–2024
2019 (pre-pandemic baseline)
4.6 / 100k, 14,414 deaths
2020 (first surge year)
6.2 / 100k, 19,384 deaths
2021 (peak)
6.7 / 100k, 20,958 deaths
2023
5.6 / 100k, 17,927 deaths
2024 (most recent CDC data)
15,364 deaths
Change 2019→2021
+46% age-adjusted rate
Source: NCHS Data Brief No. 526 (March 2025) for 2019 through 2023; CDC WONDER 2024 mortality data for the 2024 count. Rates shown are age-adjusted per 100,000 standard U.S. population. ICD-10 codes *U01.4, X93–X95. No age-adjusted 2024 rate is given here because Data Brief 526 stops at 2023 and the crude 2024 rate CDC publishes in FastStats, 4.5 per 100,000, is a different measure that cannot be read against the rates above. The 2024 count is directly comparable: firearm homicides fell to 15,364, close to the 14,414 recorded in 2019.
FBI UCR / CIUS Police-Recorded Homicide
2019–2025
Murder/nonnegligent manslaughter change 2019→2020
+29.4%
Violent crime rate 2019
366.7 / 100k
Violent crime rate 2020
387.8 / 100k (rate +5.2%)
Murder/manslaughter change 2023→2024
−14.9%
Violent crime change 2023→2024
−4.5%
Murder/manslaughter change 2024→2025
−18.1%
Violent crime change 2024→2025
−9.3%
Murder rate 2025
4.1 / 100k, ties the 1955–56 record low
Violent crime rate 2025
327.6 / 100k (from 362.9 in 2024)
Source: FBI CIUS press releases (Sep 2021, Oct 2023); FBI UCR 2024 summary (Aug 2025); FBI Reported Crimes in the Nation 2025 (Aug 2026). The murder figure is a change in the number of offenses; the violent crime figure is a change in the rate. The FBI computes each year-over-year percentage against a revised prior-year estimate, so 5.2% does not reproduce exactly from the two published rates above. Note: 2021 data has known comparability issues due to UCR→NIBRS transition.
The Trend in ContextThe spike was severe, but it must be put in historical context. Firearm homicide peaked nationally in the early 1990s, fell through the 2000s to a low of 3.5 per 100,000 in 2014, climbed back to 4.6 by 2016 and held near that level through 2019, then spiked sharply in 2020–2021. Even at the 2021 peak (6.7/100k), the rate was below the early-1990s highs. The narrative of an "unprecedented" crime wave is accurate only for the speed of the increase, not its absolute level.
How to read it: the line is the number of people killed by firearm homicide per 100,000, age-adjusted, each year from 2010 to 2023; the darker points mark 2020 onward. Points: 3.6, 3.6, 3.8, 3.6, 3.5, 4.2, 4.6, 4.6, 4.4, 4.6, 6.2, 6.7, 6.2, 5.6. Source: CDC/NCHS Data Brief No. 526 (2025), Table 4, age-adjusted firearm homicide mortality rates.
Data Caveat, UCR/NIBRS Transition
The FBI transitioned from the legacy Summary Reporting System (SRS/UCR) to the National Incident-Based Reporting System (NIBRS) during 2021. This creates comparability problems for the 2021 data point specifically. The CDC mortality series, which is independent, does not share this limitation. For the 2020 spike in particular, both systems agree, lending high confidence to that year's increase.
The "Defund the Police" Hypothesis: What the Evidence Shows
The defund hypothesis requires that budgets actually were cut. A peer-reviewed study published in Social Problems examined police budget changes across 264 U.S. cities in the period surrounding the 2020 protests. The finding is unambiguous: there is no evidence that 2020 protest exposure reduced police budgets. In some contexts, police budgets actually increased in cities that experienced the most protest activity.
Two other counts point the same way. A research note in Urban Affairs Review examined about 100 of the most populous cities and found no strong evidence of efforts to defund the police. Bloomberg CityLab's compilation of the 50 largest cities' budgets found police budgets for fiscal 2021 down 5.2% in aggregate, mostly as part of broader pandemic cost-cutting, while police spending's share of general expenditure rose slightly, from 13.6% to 13.7%. Cuts happened in some places, and they were small and short-lived.
This is not a minor caveat, it removes the primary mechanism for the "defund caused crime" claim at the national level. If budgets weren't broadly cut, budget cuts cannot explain a national trend.
| City | Claimed Action | Actual Budget Change | Sworn Officers Change |
|---|---|---|---|
| Minneapolis, MN | Pledged to "dismantle" MPD | City council vote failed; operating budget largely intact | Staffing declined via attrition, not formal cuts |
| Los Angeles, CA | $150M redirect announced | LAPD budget later restored/increased in subsequent cycles | Modest short-term reduction |
| New York City, NY | $1B NYPD "cut" announced | Largely achieved via accounting reclassifications, not real reductions | Attrition accelerated; retirements spiked |
| Austin, TX | $150M redirect | Some reductions real; subsequent years saw re-funding under state law | Staffing did decline; reversed by 2022–23 |
| National average (264 cities) | N/A | No systematic budget reduction detected | Attrition stress widespread; formal cuts uncommon |
Even where formal budget cuts were absent, police departments faced real staffing pressure after 2020 through accelerated retirements, resignations, and reduced recruiting pipelines. In 2020, the FBI reported 696,644 sworn officers nationally across reporting agencies, a figure that masked significant vacancy rates in many large departments.
However, attributing the homicide spike to staffing attrition faces a key problem: the attrition was gradual and ongoing, while the homicide spike was sharp and sudden (occurring within 2020 itself, before most attrition effects would have fully materialized).
De-Policing: Did Enforcement Pull Back?
"De-policing" is distinct from budget cuts: it refers to reduced proactive enforcement: fewer traffic stops, pedestrian stops, officer-initiated contacts, and arrests for low-level offenses. This is measurable, and it did happen.
A peer-reviewed study published in Perspectives on Politics used a regression discontinuity-in-time (RDiT) design to measure what happened to policing and crime in four cities (Austin, Los Angeles, Philadelphia, and Seattle) immediately after the onset of 2020 protests. Key findings:
Finding
Policing activity fell sharply. Standardized effect sizes ranged from −0.2 to −2.8 standard deviations across cities, with a meta-analytic coefficient around −1.5 SD. The decline was statistically significant and immediate.
Finding
Violent crime was not clearly impacted. The same design that found large depolicing effects found little evidence that the drop in police activity was accompanied by a rise in violent crime. The meta-analytic estimate for violent crime across the four cities is statistically insignificant (0.31 SD, SE 0.26, p = 0.23), and close to zero (−0.08) once weather, 311 calls and COVID cases are adjusted for. Los Angeles and Philadelphia showed rises of 0.9 and 0.5 SD on the simplest specification that did not survive the robustness checks; Austin and Seattle showed none. Arrest rates per stop rose in every city, so the stops that remained were less often fruitless.
Caveat
The study covers four cities, not the nation. It uses a bundled treatment (protests + all contemporaneous events). External validity to other cities and enforcement types is limited. Some city-specific evidence does show associations between enforcement reductions and crime increases: in Denver in 2020, across 78 neighborhoods, pedestrian stops fell 83%, vehicle stops 85% and drug arrests 76%, and violent crime rose 14.3% and property crime 27.1%, with fewer stops linked to more violent crime and fewer drug arrests to more property crime (Nix and colleagues, Criminology 2024). The increases were largest in more affluent neighborhoods, and fewer disorder arrests had no effect.
Design quality
RDiT is a high-quality quasi-experimental approach. Placebo tests, alternative bandwidth specifications, and timing checks were conducted. COVID policy timing predates the main discontinuity, reducing that confound in the immediate window.
A compilation of monthly crime data across 40 large U.S. cities through December 2025, published by the Council on Criminal Justice, provides the most current city-level picture. These cities are not nationally representative, but they show the post-peak trajectory.
−21%
Homicide rate in 35 large cities in 2025 vs. 2024, representing about 922 fewer homicides. The decline is widespread, not confined to a few outlier cities.
−22%
Gun assault rate in the same 35-city sample, 2025 vs. 2024. The weapon-specific decline mirrors the broader pattern and is consistent with a decrease in firearm-involved violence specifically.
−23%
Robbery rate in the city sample, 2025 vs. 2024. Across multiple offense categories, the post-2021 decline appears durable rather than a short-term fluctuation.
Download this conclusion: de-policing
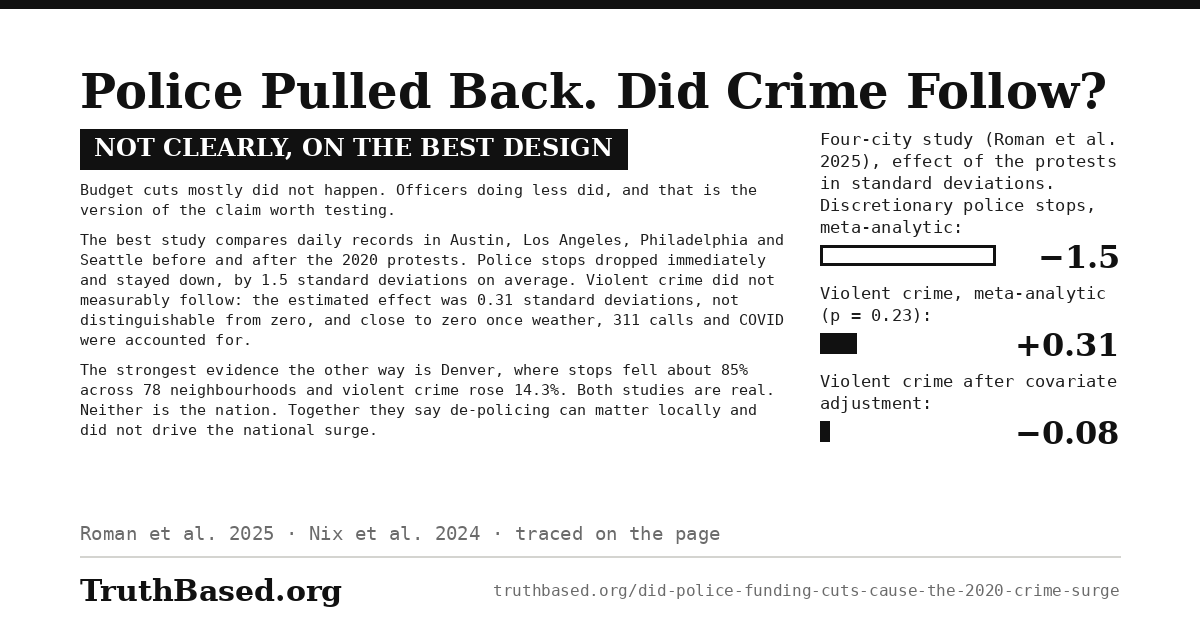
This section as one image: the four-city study of police pullback and violent crime, and the Denver study that runs the other way.
Source: Council on Criminal Justice multi-city compilation, published January 2026. In the same cities homicide was 44% below its 2021 peak and 25% below 2019. The FBI's preliminary figures for the first half of 2026 show the fall continuing: murder down 23% and violent crime down 10.6% on the same period of 2025. Note: city sample is not nationally representative; offenses vary by city; incident data subject to revision.
Competing Causes: What Else Drove the 2020 Surge?
One of the clearest correlates of the 2020 homicide spike is a historic surge in firearm purchases. NICS firearm background checks jumped from about 28.4 million in 2019 to 39.7 million in 2020, a 40% increase in a single year and the highest annual total on record. Checks stayed elevated at 38.9 million in 2021 before falling to 31.6 million in 2022.
The CDC data provides critical evidence here: the 2020–2021 surge was almost entirely a firearm homicide increase. Non-firearm homicide did not rise proportionally. This pattern (where the firearm-specific harm increases while non-firearm harm does not) is exactly what a weapon availability hypothesis would predict.
How to read it: each bar is the number of firearm background checks run through the FBI's NICS system in that year, in millions: 25.2, 26.2, 28.4, 39.7, 38.9, 31.6, 29.9, 28.1. Source: FBI NICS firearm background checks, month/year totals. A check is not one-to-one with a gun sold: a single check can cover several firearms, and several states run permit checks through NICS that involve no immediate sale.
Pandemic-Era Social DisruptionThe 2020 crime surge coincided with the most severe social disruption the United States had experienced in decades. Schools closed. Courts halted proceedings. Social services were interrupted. Economic stress peaked suddenly. Routine activities that structure social life (work, school, community organizations) were suspended or radically altered.
Criminology research has long linked disruptions to routine activities and social controls with increases in violence. The 2020 spike was also preceded by massive civil unrest: protests, fires, curfews, and the social and psychological aftermath of George Floyd's killing in late May 2020. The homicide increase appears in data starting in June 2020, coinciding with the protests and their aftermath rather than with any specific budget vote.
The Timing Problem for Policing Explanations
Multi-Factor Evidence Summary
If police budget cuts caused the crime spike, the spike should follow the cuts. But formal budget cuts, where they occurred at all, happened in city council votes in summer and fall 2020. The homicide increase began immediately in late May/June 2020, before most budget processes concluded. The timing is more consistent with the simultaneous protests and social disruption as precipitating factors than with formal budget changes.
| Proposed Cause | Evidence Strength | Key Support | Key Problem |
|---|---|---|---|
| Police budget defunding | Not supported | Intuitive mechanism | 264-city study: no systematic cuts occurred |
| De-policing / enforcement pullback | Weak–Moderate (localized) | RDiT shows enforcement did decline | Same RDiT finds no resulting crime increase |
| Firearm acquisition surge | Moderate | Firearm-specific homicide increase; NICS surge | NICS is imperfect proxy; causal channel uncertain |
| Pandemic social disruption | Moderate–Strong | National increase coincides with protests/disruption; broad-based | Hard to separate from simultaneous factors |
| Measurement artifact | Not supported for homicide | NIBRS transition is a real issue for 2021 | FBI and CDC both show 2020 increase; independent systems |
Steelman: The Best Case for Both Sides
The strongest version of this argument focuses not on formal budget cuts but on the legitimacy crisis and behavioral withdrawal that followed the Floyd killing and protests. The argument runs: even without formal defunding, officers reduced proactive activity, the data confirms this. Reduced deterrence and reduced clearance rates would be expected to increase violence. The Ferguson Effect (reduced policing following high-profile use-of-force controversies) has some supporting evidence from earlier years. The timing of the June 2020 onset is consistent with a change in officer behavior rather than a budget change alone.
Best evidence
Proactive enforcement demonstrably fell post-protests in multiple cities. Clearance rates for homicide were already declining pre-2020 and worsened during the surge, and even in 2025 police cleared only 47.4% of reported violent crimes. Reduced closure rates mean fewer killers are apprehended, potentially reducing deterrence. The Denver neighborhood study shows enforcement reductions associated with crime increases.
Rebuttal
The best quasi-experimental evidence directly measures both enforcement decline and crime outcomes and finds no clear causal link. The firearm-specific nature of the surge is better explained by weapon availability. The rapid post-2021 decline occurred without a reversal of the underlying policing controversies.
The strongest version of this argument is that the pandemic, not policing, was the dominant driver. COVID-19 disrupted every institution simultaneously: courts stopped processing cases, social services shut down, schools closed, and millions of people lost jobs overnight. Gun purchases nearly doubled. These shocks overwhelmed normal social controls with no connection to police behavior. The same period saw homicide increases in countries that had no "defund" movement. The rapid decline after 2021, while policing controversies continued, suggests the pandemic-era shocks were temporary rather than policing-related.
Best evidence
Firearm homicide rose while non-firearm homicide did not. Consistent with weapon availability, not policing changes. The surge was rapid and then partially reversed without a return to pre-controversy policing levels. Cross-system evidence (FBI + CDC) shows the same pattern regardless of reporting method.
Rebuttal
This does not fully explain city-level heterogeneity. Some places with more aggressive enforcement actions had worse outcomes than others. The pandemic alone does not explain why firearm homicide specifically spiked so much more than other causes of death.
The Data Verdict
FALSE
“Defunding police caused the 2020 crime surge.” Budget defunding did not happen at scale nationally (264-city study). The mechanism does not exist where the trend is claimed to be national.
PARTLY TRUE
“Policing pullback contributed to the surge.” De-policing did occur. Localized effects are plausible. But the best causal evidence does not support this as the dominant national explanation, and the firearm-acquisition and pandemic-disruption channels have stronger support.
FALSE
“Crime is still out of control.” Murder fell 14.9% in 2024 and a further 18.1% in 2025, and violent crime fell 4.5% then 9.3%. The 2025 murder rate of 4.1 per 100,000 ties the lowest the FBI has recorded. A 35-city sample had already shown homicides down 21% in 2025; the national data came in close to what that sample projected. The surge has reversed.
TRUE
“The 2020 homicide spike was real.” Confirmed by two independent data systems. Firearm homicide rose 35% from 2019 to 2020 and 46% from 2019 to the 2021 peak. This is not in dispute.
On the strongest causal and mechanism evidence available, policing changes after 2020 are not supported as the dominant national cause of the 2020–2021 violence surge. "Defund the police" as a national budget-cutting program largely did not happen. De-policing did occur, but the best quasi-experimental evidence finds no clear resulting increase in violent crime in treated cities.
The cross-system evidence most strongly supports a multi-factor pandemic-era explanation with increased firearm availability as a central component. This does not mean policing is irrelevant to crime. Decades of research show it matters. It means the specific "defund caused crime" causal chain is not supported by the available evidence for the 2020–2021 national surge.
The verdict: what the evidence shows
Claims and evidence
Claim“Defunding police caused the 2020 crime surge”
EvidenceNot supported nationally. A study of 264 cities found no evidence that 2020 protests led to police budget cuts. Budgets in many cities actually increased.
Claim“The 2020 crime surge was unprecedented”
EvidencePartly true for homicide (+29.4% murder in 2020, per FBI). False for overall violent crime, which remains well below 1990s levels. The surge was severe but not historically unique.
Claim“Crime is still out of control”
EvidenceFalse. FBI national data for 2025 show murder down 18.1% and violent crime down 9.3%, the largest one-year declines in both since the FBI began national estimates in 1936. The 2025 murder rate of 4.1 per 100,000 ties the 1955 and 1956 record low.
Claim“The spike was just a measurement artifact”
EvidenceFalse. The increase appears in both FBI police-recorded data and CDC mortality data, which use entirely separate reporting systems. Both can’t be an artifact simultaneously.
Download the conclusion
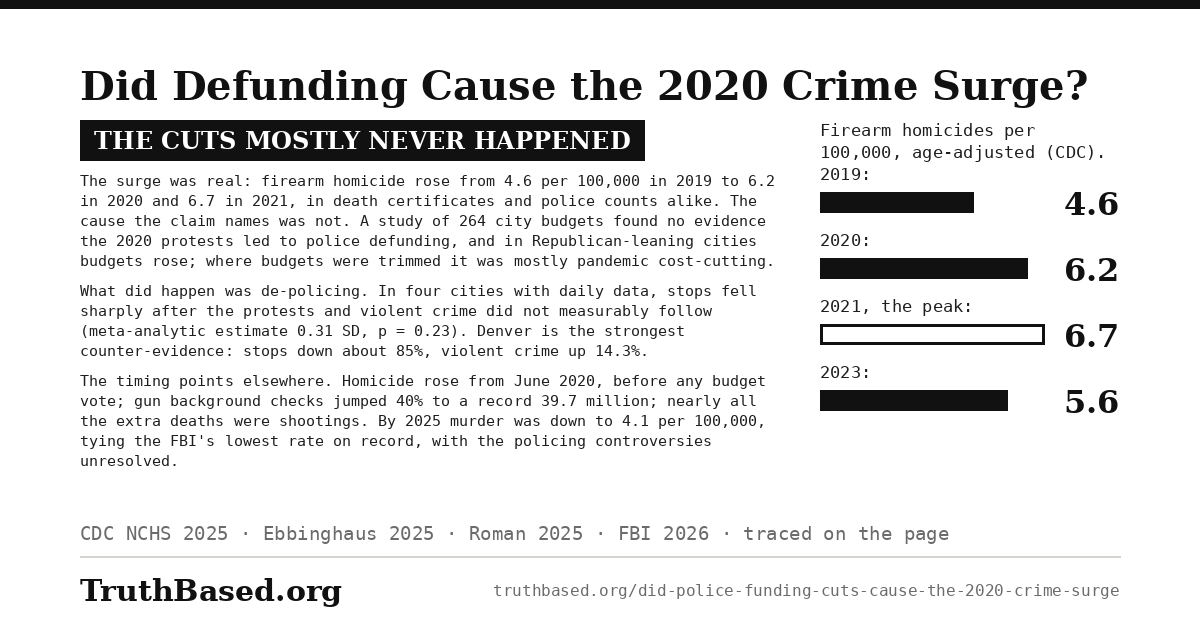
The verdict above as one image, with the firearm homicide rates from 2019 to 2023 as its chart. It is 1,200 by 630 pixels, the size social networks use for link previews, and anyone may download it and post it.
What would change this conclusion
• Evidence that cities with the largest budget/staffing cuts experienced proportionally larger homicide increases, consistent with a dose-response relationship. (Not observed in 264-city budget study.)
• A causal mechanism: a study showing that specific enforcement reductions preceded homicide increases in the same jurisdictions, with strong pre-trend evidence. (The best available design finds the opposite.)
• Cross-national evidence: countries that cut policing saw crime surges while those that didn't were spared. (The 2020 surge was largely U.S.-specific, while peer nations also saw some COVID-era homicide increases without defunding.)
• A multi-city pre-registered DiD/event-study linking exogenous variation in policing to subsequent homicide increases (validated with mechanism shifts and strong pre-trends) would upgrade the de-policing hypothesis.
• City-level clearance and response-time panels showing that clearance fell sharply before homicide increases, with credible identification, would strengthen the policing-centric narrative.
• Better quasi-experimental designs connecting specific firearm acquisition changes to firearm homicide, beyond NICS proxies, would sharpen the weapon-availability hypothesis.
Sources
Ebbinghaus, Bailey & Rubel. The Effect of the 2020 Black Lives Matter Protests on Police Budgets: How "Defund the Police" Sparked Political Backlash. Social Problems, vol. 72 no. 3. Source for the 264-city analysis, the finding of no evidence that protests led to police defunding, and the finding that budgets rose in cities with large Republican vote shares. academic.oup.com
Curtin SC. Trends in Death Rates for Leading Methods of Injury: United States, 2003–2023. NCHS Data Brief No. 526, March 2025. Table 4 is the source for every firearm homicide count and rate in this article and for the chart series: 14,414 deaths at 4.6 per 100,000 in 2019, 19,384 at 6.2 in 2020, 20,958 at 6.7 in 2021, 17,927 at 5.6 in 2023. Table 1 is the source for the overall homicide rate, 6.0 in 2019 rising to 7.8 in 2020. cdc.gov
CDC WONDER / NCHS FastStats. Underlying cause of death, firearm homicide, 2024. Source for the 2024 count of 15,364 firearm homicides. CDC publishes a crude rate of 4.5 per 100,000 for 2024; the rates elsewhere in this article are age-adjusted and the two are not interchangeable, which is why only the count is used. cdc.gov
CDC. Notes from the Field: Increases in Firearm Homicide and Suicide Rates, United States, 2020–2021. MMWR. Source for the firearm homicide increase of about 35% from 2019 to 2020 and the 2021 figures. cdc.gov
Roman, Fredriksson, Cassella, Epp & Walker. The George Floyd Effect: How Protests and Public Scrutiny Changed Police Behavior. Perspectives on Politics. The regression discontinuity-in-time study of Austin, Los Angeles, Philadelphia and Seattle. Source for the policing decline of 0.2 to 2.8 standard deviations, the meta-analytic coefficient of 1.5 standard deviations, and the finding that the authors could not reject their hypothesis of no change in violent crime. The meta-analytic violent crime estimate is 0.31 SD, SE 0.26, p = 0.23. cambridge.org
Nix, Huff, Wolfe, Pyrooz & Mourtgos. When police pull back: Neighborhood-level effects of de-policing on violent and property crime. Criminology 62(1), 2024, 156–171. The Denver study referred to in the de-policing and steelman sections. Found violent crime up 14.3% and property crime up 27.1% in Denver in 2020, with pedestrian stops down 83%, vehicle stops down 85%, drug arrests down 76% and disorder arrests down 62%; reduced stops associated with more violent crime and reduced drug arrests with more property crime, disorder arrests with no effect. Effects varied widely across the 78 neighborhoods studied, and were larger in more affluent ones. This is the strongest city-level evidence running against the four-city result above, which is why both are stated. onlinelibrary.wiley.com
Bloomberg CityLab, Cities Say They Want to Defund the Police. Their Budgets Say Otherwise (January 2021), and Urban Affairs Review research note on about 100 of the most populous cities (2023). Sources for the 5.2% aggregate reduction in the 50 largest cities' fiscal 2021 police budgets with the share of general spending rising from 13.6% to 13.7%, and for the second finding of no strong evidence of defunding. bloomberg.com mavmatrix.uta.edu
FBI. Crime statistics releases for 2019, 2020, 2024 and 2025 (the 2025 summary released 18 August 2026). Also the source for the 2025 clearance rate of 47.4% for violent crime and the preliminary first-half 2026 figures (murder down 23%, violent crime down 10.6%). Source for the 2019 violent crime rate of 366.7 per 100,000, the 2020 rate of 387.8, the 29.4% rise in murder and nonnegligent manslaughter in 2020, the 696,644 sworn officers reported by 13,377 agencies as of 31 October 2020, the 2024 declines of 14.9% and 4.5%, and the 2025 declines of 18.1% and 9.3% with a murder rate of 4.1 per 100,000. fbi.gov
FBI. Uniform Crime Reporting Program and Crime in the United States. Source for the police-recorded homicide and violent crime figures and for the UCR to NIBRS transition caveat affecting 2021 comparability. fbi.gov
FBI. NICS Firearm Background Checks, month and year totals. Source for the background check chart: 25.2 million in 2017, 26.2 in 2018, 28.4 in 2019, 39.7 in 2020, 38.9 in 2021, 31.6 in 2022, 29.9 in 2023, 28.1 in 2024. The 40% single-year rise from 2019 to 2020 is also given in Congressional Research Service report IF11781. fbi.gov
Council on Criminal Justice. Crime Trends in U.S. Cities: Year-End 2025 Update, January 2026. Source for the 40-city compilation and the 2025 against 2024 changes in the 35 cities reporting homicide: homicide rate down 21%, representing 922 fewer homicides, gun assault down 22%, robbery down 23%. counciloncj.org
Note on two different measures. The overall homicide rate and the firearm homicide rate moved by different amounts in 2020. CDC recorded a rise from 6.0 to 7.8 per 100,000 in the overall homicide rate, about 30%, and from 4.6 to 6.2 in firearm homicides specifically, about 35%. The same distinction applies to the FBI figures: its 29.4% for 2020 is a change in the number of murders, while its 5.2% is a change in the violent crime rate.
Cite this article
TruthBased.org. “Did Police Funding Cuts Cause the 2020 Crime Surge?” Updated September 2026. https://www.truthbased.org/did-police-funding-cuts-cause-the-2020-crime-surge