Economics & Policy
How Bad Is the National Debt?
What the debt figures measure, how the debt changed under each president, and what CBO projects next.
Economics & Policy
What Causes Inflation?
What drove the 9.1% peak of 2022 and the 2026 rise, and what the Fed did.
Economics & Policy
Which Presidents Created the Most Jobs?
Payroll jobs added under each president since 1939, and how much of the count a president controls.
Where Does U.S. Federal Spending Go?
The Congressional Budget Office (CBO) projected in February 2026 that the federal government would spend about $7.4 trillion in fiscal 2026. This page shows where that money goes. It tests four claims, among them that defense is the largest cost and that cutting foreign aid would solve the budget problem. It also compares U.S. health spending with other countries’.
Jump to the verdict ↓
The short answer
Mostly to health care, Social Security and interest on the debt. The Congressional Budget Office (CBO) projected in February 2026 that health care programs such as Medicare and Medicaid would take $1.9 trillion of the $7.4 trillion spent in fiscal 2026. Social Security comes next, at $1.7 trillion, then net interest at $1.0 trillion, more than defense. By contrast, international affairs, which includes foreign aid, was 0.6% of spending in fiscal 2025, by the Treasury’s count.
Where the $7.4 trillion goes
The Congressional Budget Office (CBO) counts Medicare together with Medicaid, the Children’s Health Insurance Program (CHIP) and marketplace subsidies for health insurance as the major health care programs. In its projections for fiscal 2026 these programs come to $1,908 billion, about a quarter of the $7,449 billion total and the largest part of federal spending. But the largest single program is Social Security, at $1,666 billion.
Most federal spending does not need a new vote each year. In the words of the Treasury’s guide to federal spending, mandatory spending “does not require an annual vote by Congress”. It covers Social Security, the health care programs and the other mandatory programs. In CBO’s 2026 figures it comes to $4,529 billion, 60.8% of outlays.
By contrast, Congress and the President approve discretionary spending each year in appropriations. It comes to $1,880 billion, or 25.2%, and holds defense and the nondefense programs. Net interest is 13.9%.
How to read it: each bar is one of CBO’s categories of federal spending in fiscal 2026, in billions of dollars, as CBO projected it under current law. The health care programs bar adds Medicare to Medicaid, CHIP and marketplace subsidies. The table below gives each value and its share of the $7,449 billion total. Source: CBO, The Budget and Economic Outlook: 2026 to 2036, as presented in testimony on 11 March 2026.
| Category | Billions of dollars | Share of outlays |
|---|---|---|
| Health care programs | 1,908 | 25.6% |
| Of which, Medicare | 1,063 | 14.3% |
| Of which, Medicaid, CHIP and marketplace subsidies | 845 | 11.3% |
| Social Security | 1,666 | 22.4% |
| Net interest | 1,039 | 13.9% |
| Nondefense discretionary | 996 | 13.4% |
| Other mandatory programs | 955 | 12.8% |
| Defense | 885 | 11.9% |
| Total outlays | 7,449 | 100.0% |
Defense, at $885 billion, costs less than any of the other five categories. Net interest on the debt, at $1,039 billion, costs more than defense and more than all the nondefense discretionary programs together.
Interest now costs more than defense
Net interest on the debt passed national defense in fiscal 2024, by the Treasury’s count of outlays by function. Interest cost $881.7 billion that year and defense $874.0 billion. A year earlier defense had still cost more, $820.7 billion against $659.2 billion for interest. In the table of outlays by function of the Office of Management and Budget (OMB), which starts in 1940, no earlier year has interest above defense.
The gap widened in fiscal 2025, to $970.4 billion for interest against $916.6 billion for defense. It has held in fiscal 2026 so far. In the first quarter of fiscal 2026, October to December 2025, interest cost $270.3 billion and defense $266.9 billion. Through August 2026, eleven months into the year, interest came to $1,017.0 billion. Over the same months defense came to $876.2 billion.
The Treasury’s national defense figure is larger than the defense line of the Congressional Budget Office (CBO). CBO’s line counts only discretionary spending. For fiscal 2025 the Treasury’s figure was $916.6 billion and CBO’s $893 billion. On either measure, interest cost more.
How to read it: the line is federal net interest outlays as a percentage of gross domestic product (GDP) in each fiscal year. The years 2010 to 2025 are actual figures from OMB’s Historical Table 3.1; 2026 is CBO’s projection. The axis starts at zero, and the table below gives each value.
| Fiscal year | Net interest, % of GDP |
|---|---|
| 2010 | 1.3 |
| 2011 | 1.5 |
| 2012 | 1.4 |
| 2013 | 1.3 |
| 2014 | 1.3 |
| 2015 | 1.2 |
| 2016 | 1.3 |
| 2017 | 1.4 |
| 2018 | 1.6 |
| 2019 | 1.8 |
| 2020 | 1.6 |
| 2021 | 1.5 |
| 2022 | 1.9 |
| 2023 | 2.4 |
| 2024 | 3.0 |
| 2025 | 3.2 |
| 2026, CBO projection | 3.3 |
The average interest rate the Treasury pays has risen. On its interest-bearing debt the rate was 1.60% in August 2021 and 3.49% in August 2026, by the Treasury’s monthly figures. CBO expects net interest to keep growing “as longer-term interest rates rise and debt mounts”.
In CBO’s projections, net interest grows from $1,039 billion in 2026 to $2,144 billion in 2036. As a share of GDP it rises from 3.3% to 4.6%. By 2036 it is nearly twice CBO’s defense line, $1,100 billion that year.
Debt held by the public is what the government owes to lenders outside it, from individuals and companies to foreign governments and the Federal Reserve. Gross federal debt also counts what the government owes its own trust funds and other accounts. In CBO’s projections, debt held by the public is $32.1 trillion in 2026, or 101% of GDP. It rises to 120% of GDP in 2036, above its previous high of 106% in 1946.
Download this conclusion: is defense the government’s biggest cost?
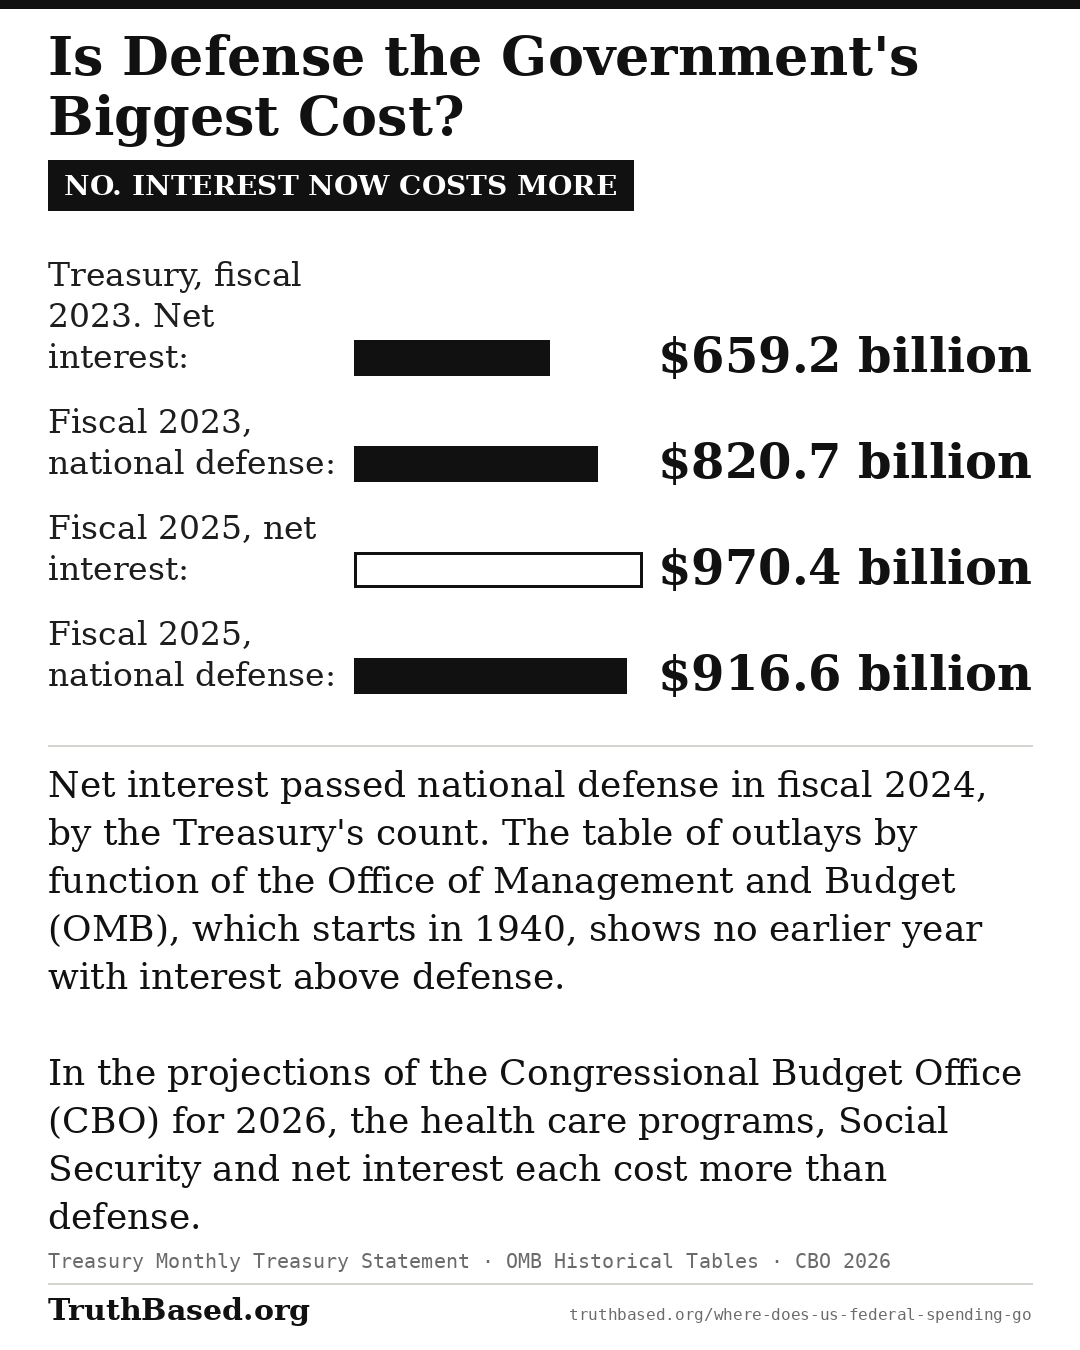
This card takes apart the claim that defense is the government’s biggest cost. It shows the Treasury’s outlays for net interest and national defense in two years. In fiscal 2023 interest cost $659.2 billion and defense $820.7 billion. In fiscal 2025 interest cost $970.4 billion and defense $916.6 billion. It is 1,080 by 1,350 pixels, and anyone may download it and post it.
Why health care costs so much
The United States spends far more on health care per person than any other member of the Organisation for Economic Co-operation and Development (OECD), a group of 38 countries. In 2024 U.S. health spending came to $14,823 per person, in dollars converted at purchasing power parities, which adjust for differences in price levels between countries. That is about 2.4 times the OECD average of $6,097. Switzerland, the next highest, spent $9,927.
The federal government sponsored 31% of the nation’s health spending in 2024, by the count of the Centers for Medicare & Medicaid Services (CMS). It sponsored more than households, businesses or state and local governments did. On CMS’s own measure, national health expenditure, the country spent $5.3 trillion on health in 2024, or 18.0% of gross domestic product (GDP). The OECD’s measure, used in the table, gives 17.2%.
| Country | Spending per person, US$ at purchasing power parity | Spending, % of GDP | Life expectancy at birth, years | Infant deaths per 1,000 live births |
|---|---|---|---|---|
| United States | 14,823 | 17.2% | 79.0 | 5.5 |
| Switzerland | 9,927 | 11.4% | 84.2 | 3.3 |
| Germany | 9,584 | 12.2% | 81.2 | 3.3 |
| Sweden | 7,906 | 11.2% | 83.8 | 2.0 |
| Australia | 7,885* | 10.8%* | 83.0 | 3.3* |
| France | 7,433 | 11.3% | 83.0 | 4.1 |
| Canada | 7,372 | 11.5% | 82.2 | 4.5 |
| United Kingdom | 7,008 | 11.1% | 81.3* | 4.2 |
| Japan | 5,884* | 10.3%* | 84.1* | 1.8 |
| Average of OECD members | 6,097 | 9.3% | 81.3 | 3.8 |
Figures marked * are the OECD’s estimates or provisional values. The average is the unweighted mean of the members with a 2024 figure. All 38 members have one for spending. For life expectancy 37 do, and for infant deaths 35.
The extra spending does not show up in life expectancy or infant deaths. Life expectancy at birth in the United States was 79.0 years in 2024, lower than in any of the eight other countries in the table. The U.S. infant death rate, 5.5 per 1,000 live births, was higher than in any of them.
Outcomes also depend on more than health care. Irene Papanicolas, Liana Woskie and Ashish Jha compared the United States with ten high-income countries in 2018, using data mostly from 2013 to 2016. The United States had the highest share of adults who were overweight or obese, 70.1%, and the second-lowest share who smoked daily.
The 2018 study, in the Journal of the American Medical Association, found that Americans used about as much care as people in the other countries. Americans did have more imaging than average. They had 118 magnetic resonance imaging scans per 1,000 people, second only to Germany. They also had the most computed tomography scans in the study, 245 per 1,000. The authors concluded that prices of labor and goods, including drugs, and administrative costs “appeared to be the major drivers” of the difference in cost. Generalist doctors in the United States earned $218,173, against at most $154,126 in the other countries.
How much administration costs depends on what is counted. Papanicolas and colleagues counted the planning, regulating and managing of health systems and services. On that measure they put administration at 8% of U.S. health spending. In the other countries it ranged from 1% to 5%. David Himmelstein, Terry Campbell and Steffie Woolhandler counted the administration done by insurers and providers. They estimated it at 34.2% of U.S. health spending in 2017, against 17.0% in Canada, counting only the kinds of spending whose administrative costs could be measured.
Drug prices are higher too. RAND, a nonprofit research organization, compared drug prices for the Department of Health and Human Services in 2024. It found that U.S. prices for brand-name drugs in 2022 were 422% of prices in 33 other OECD countries. After an adjustment for the rebates drug makers pay U.S. payers, they were 308%. Unbranded generic drugs were cheaper in the United States, at 67% of the other countries’ prices.
What a single-payer system would cost
Single-payer usually means that one entity collects the money and pays for everyone’s health care. A 2017 review of 25 proposals found no agreed definition, and plans that differ widely.
In 2020 the Congressional Budget Office (CBO) analyzed five illustrative single-payer designs based on Medicare’s fee-for-service program, known as Original Medicare. Each would raise the federal budget’s share of health spending, whatever it did to the nation’s total. CBO projected that federal subsidies for health care in 2030 would rise by $1.5 trillion to $3.0 trillion under them, compared with current law. Under the same designs, national health expenditures in 2030 would change by between a decrease of $0.7 trillion and an increase of $0.3 trillion.
The design decides where in those ranges a plan lands. In CBO’s analysis, lower payment rates for providers and less administrative spending by payers did most to lower national health spending. Greater use of care did most to raise it, because coverage would be nearly universal and out-of-pocket costs lower.
| Estimate | What it measures | Result |
|---|---|---|
| CBO, 2020, five illustrative designs | Change in federal subsidies for health care, 2030 | +$1.5 trillion to +$3.0 trillion |
| CBO, 2020, the same designs | Change in national health expenditures, 2030 | −$0.7 trillion to +$0.3 trillion |
| Charles Blahous, Mercatus Center, 2018 | Added federal budget commitments, 2022 to 2031 | +$32.6 trillion |
| Robert Pollin and colleagues, Political Economy Research Institute (PERI), 2018 | Change in national health consumption spending | −9.6% on 2017 spending; −$5.1 trillion over 2017 to 2026 |
The two 2018 estimates answer different questions. Charles Blahous of the Mercatus Center estimated that Medicare for All would add about $32.6 trillion to federal budget commitments in 2022 to 2031. Those are its first ten years of full implementation, and he called the estimate conservative. The Political Economy Research Institute (PERI), at the University of Massachusetts Amherst, studied the Medicare for All Act of 2017. It estimated that the nation’s health consumption spending would fall by about 9.6%. That fall rests on PERI’s assumption of savings of about 19.2%, against a rise in demand of about 12.0% that PERI calls a high-end estimate.
Download this conclusion: what would a single-payer system cost?
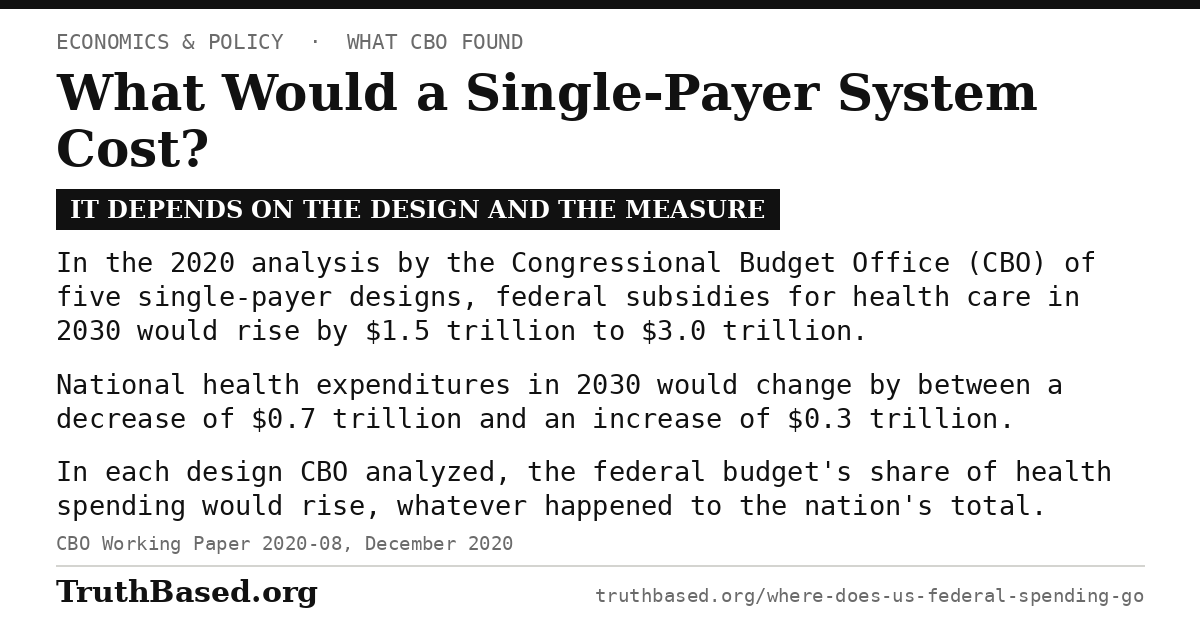
This card sets out what the Congressional Budget Office found five illustrative single-payer designs would cost in 2030, compared with current law, on two measures. Federal subsidies for health care would rise by $1.5 trillion to $3.0 trillion. National health expenditures would change by between a decrease of $0.7 trillion and an increase of $0.3 trillion. It is 1,200 by 630 pixels, and anyone may download it and post it.
Deficits, taxes and an aging population
Revenue covers about three-quarters of federal spending. In the projections of the Congressional Budget Office (CBO) for fiscal 2026, the government collects $5,596 billion and spends $7,449 billion. The gap, the deficit, is $1,853 billion, or 5.8% of gross domestic product (GDP).
Deficits grow over the next ten years. CBO projects the deficit at $3.1 trillion in 2036, or 6.7% of GDP. But the primary deficit, which leaves out net interest, falls from 2.6% of GDP in 2026 to 2.1% in 2036. “Rising net interest costs drive much of that increase,” in CBO’s words. The Committee for a Responsible Federal Budget (CRFB), reading CBO’s figures, puts the average deficit over 2027 to 2036 at 6.1% of GDP.
CBO expects greater spending on Social Security and Medicare to push mandatory spending up relative to GDP, and the number of older Americans is rising. The 2010 Census counted 40.3 million people aged 65 and older. The Census Bureau’s 2023 projections put the number at 71.2 million in 2030 and 82.1 million in 2050.
Social Security’s long-range shortfall comes largely from rising costs “primarily due to demographic trends”, in the Congressional Research Service’s summary of the trustees’ 2026 report. In 2025 there were about 2.6 covered workers for each Social Security beneficiary, by the trustees’ count as the National Committee to Preserve Social Security and Medicare reports it.
CRFB says tax expenditures can be thought of as spending through the tax code. They are provisions, such as credits and deductions, that reduce tax owed, increase refunds, or both. The Joint Committee on Taxation (JCT) projected that they would total $2.3 trillion in fiscal 2026, as CRFB reports. In 2024 the Biden administration proposed raising the corporate income tax rate from 21% to 28%. The Treasury estimated the change would raise $1.35 trillion over fiscal years 2025 to 2034.
The case for spending more, and the case for borrowing less
People who argue for more public spending, on health care above all, start from what the country already pays. In 2024 the United States spent more per person on health care than any other member of the Organisation for Economic Co-operation and Development (OECD), about 2.4 times the average. In the 2020 analysis by the Congressional Budget Office (CBO), some single-payer designs would lower the nation’s total health spending while covering nearly everyone. The fall would be up to $0.7 trillion in 2030.
Measured against its economy, Japan carries far more debt than the United States. By the International Monetary Fund’s figures, Japan’s gross government debt has been above 200% of its gross domestic product (GDP) since 2013. It was 214.5% in 2024, against 122.3% for the United States.
People who argue for cutting deficits start from where net interest is heading. Net interest already costs more than defense, and CBO projects it to double, to $2,144 billion in 2036. Debt held by the public, owed to lenders outside the government, reaches 120% of GDP that year, higher than at any point in the nation’s history. The Committee for a Responsible Federal Budget (CRFB) wants deficits brought down toward 3% of GDP. It warns that high and rising debt brings “greater risk of a fiscal crisis”.
Social Security’s trustees project that its retirement trust fund will run out in the fourth quarter of 2032. After that, CRFB notes, the law calls for benefits to be cut to match revenue.
The figures settle where the money goes and how fast net interest is growing, but not which side is right. That is a choice about what government should do and who should pay for it.
The figures do rule out two shortcuts. Ending foreign aid cannot close the deficit: all international affairs spending, aid included, was $45.2 billion in fiscal 2025, against a deficit of $1,775 billion. Closing the deficit through annual appropriations alone would mean ending almost all of them. That is because in CBO’s projections the 2026 deficit, $1,853 billion, is nearly as large as all discretionary spending, $1,880 billion, defense included.
The verdict: what the evidence shows
Mostly to health care, Social Security and interest on the debt. These three are the largest parts of the $7,449 billion that the Congressional Budget Office (CBO) projected for fiscal 2026, in that order. Defense, at $885 billion, comes after each of them. Net interest overtook national defense in fiscal 2024, for the first time in the Office of Management and Budget’s table of outlays by function, which starts in 1940. CBO projects it to double by 2036.
Two claims about the budget do not fit these figures. Defense is not the largest cost. Ending foreign aid could not close the deficit either: all international affairs spending was 0.6% of outlays in fiscal 2025.
U.S. health care is also unusually expensive: in 2024 spending per person was about 2.4 times the average of the Organisation for Economic Co-operation and Development (OECD). In a 2018 study comparing the United States with ten high-income countries, prices and administrative costs, not more care, appeared to be the main drivers of the difference in cost.
Four claims about federal spending, against the evidence
Claim“We spend more on defense than anything else.”
FalseIn the Congressional Budget Office’s projections for fiscal 2026, defense, at $885 billion, costs less than the health care programs, Social Security or net interest. Net interest has cost more than national defense since fiscal 2024.
Claim“Cutting foreign aid would solve the budget problem.”
FalseAll international affairs spending, foreign aid included, was $45.2 billion in fiscal 2025, 0.6% of federal outlays. The deficit that year was $1,775 billion.
Claim“The U.S. can’t afford Medicare for All.”
Depends on the designIn the Congressional Budget Office’s 2020 analysis of illustrative single-payer designs, federal subsidies for health care in 2030 would rise by $1.5 trillion to $3.0 trillion. National health expenditures in 2030 would change by −$0.7 trillion to +$0.3 trillion.
Claim“The U.S. health care system is the best in the world.”
Not on these measuresOf the members of the Organisation for Economic Co-operation and Development, the United States spent the most per person in 2024, about 2.4 times the average. That year its life expectancy was lower, and its infant death rate higher, than in eight other high-income countries.
Download the conclusion
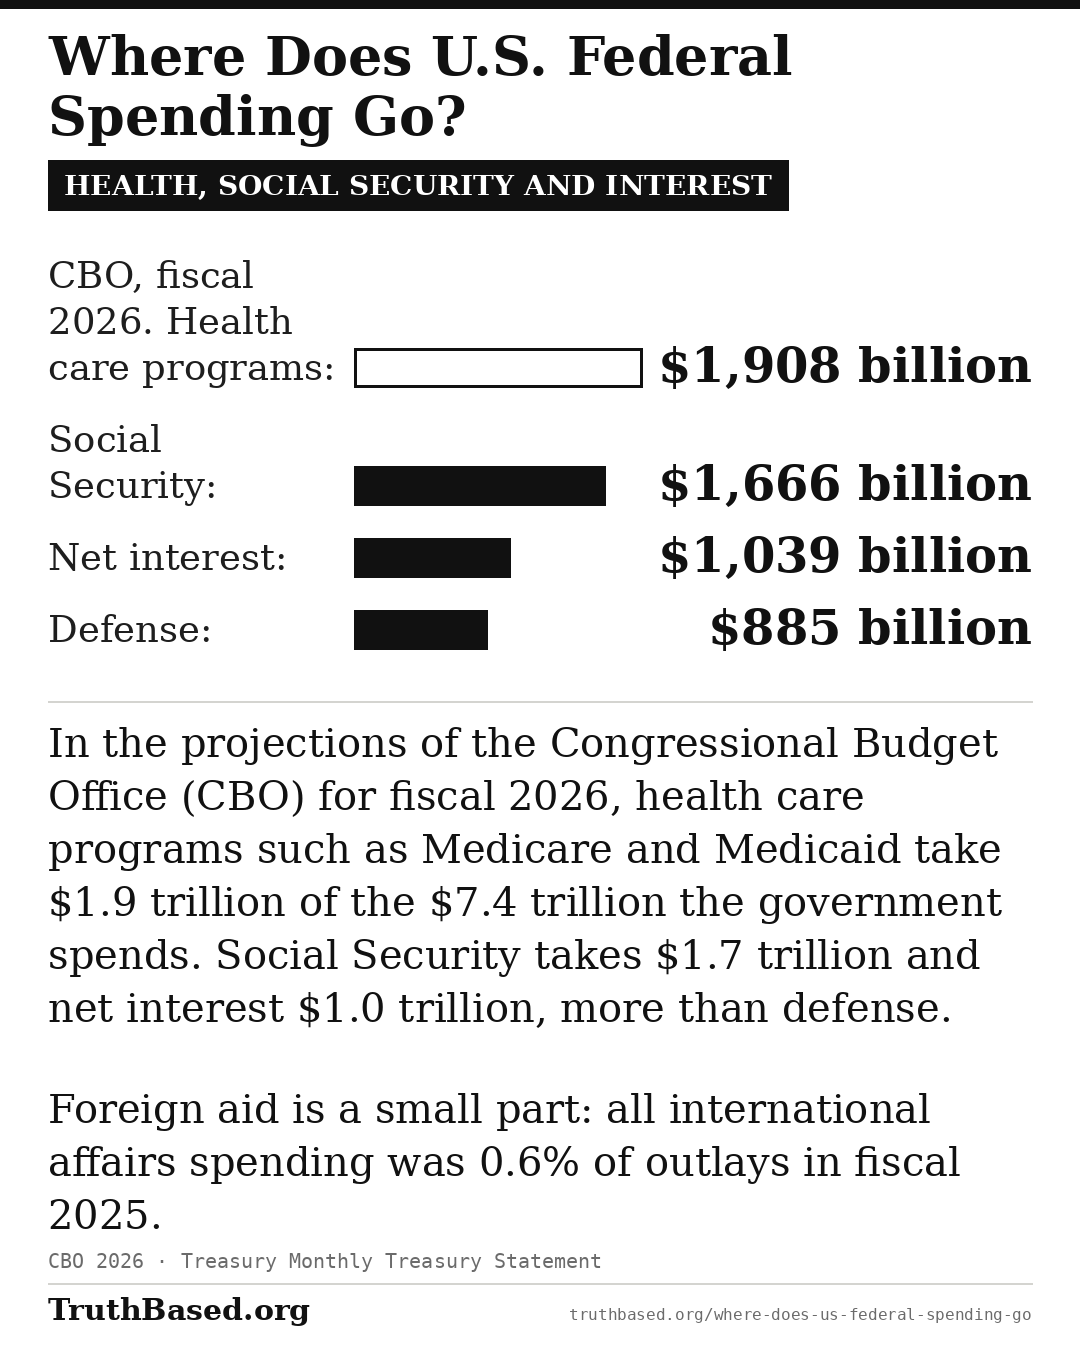
The verdict above as one image, with four of the Congressional Budget Office’s projections for fiscal 2026 behind it. Health care programs take $1,908 billion and Social Security $1,666 billion. Net interest takes $1,039 billion and defense $885 billion. It also gives the $7.4 trillion total and the Treasury’s figure for international affairs, 0.6% of outlays in fiscal 2025. The image is 1,080 by 1,350 pixels, and anyone may download it and post it.
What would change this conclusion
This article concludes that:
- health care programs, Social Security and net interest are the three largest parts of federal spending in fiscal 2026, in the projections of the Congressional Budget Office (CBO);
- defense comes after all three of them;
- net interest has cost more than national defense since fiscal 2024, and CBO projects it to double by 2036;
- U.S. health spending per person was about 2.4 times the average of the Organisation for Economic Co-operation and Development (OECD) in 2024;
- prices and administrative costs appeared to be the main drivers of the difference in cost in the 2018 study comparing the United States with ten high-income countries;
- ending foreign aid could not close the deficit.
These conclusions would be falsified by:
• The Treasury’s year-end Monthly Treasury Statement for fiscal 2026, or a later CBO baseline, showing national defense above net interest, Social Security or the health care programs
• OECD Health Statistics showing U.S. health spending per person close to the OECD average
• A comparison of high-income countries finding that Americans use far more care, rather than paying higher prices
• Treasury outlay figures in which international affairs spending, foreign aid included, came to as much as the federal deficit
Sources
Congressional Budget Office. The Budget and Economic Outlook: 2026 to 2036. Testimony of Phillip L. Swagel before the Subcommittee on Fiscal Responsibility and Economic Growth, Senate Committee on Finance, 11 March 2026. Source for CBO’s February 2026 projections: outlays by category in fiscal 2026, revenues, the deficit and the primary deficit, net interest in 2026 and 2036, defense in 2036, debt held by the public and its 1946 high, CBO’s statements on what drives spending and interest, and its actual defense figure for fiscal 2025. cbo.gov finance.senate.gov
U.S. Department of the Treasury, Bureau of the Fiscal Service. Monthly Treasury Statement, Table 9: Summary of Receipts by Source, and Outlays by Function. Source for net interest and national defense outlays in fiscal 2023, 2024 and 2025, in the first quarter of fiscal 2026 and in fiscal 2026 through August, and for international affairs outlays, total outlays and the deficit in fiscal 2025. fiscaldata.treasury.gov
Office of Management and Budget. Historical Tables, Budget of the U.S. Government, Fiscal Year 2027, April 2026. Table 3.1, Outlays by Superfunction and Function: 1940–2031. Source for net interest against national defense in every year since 1940, and for net interest as a percentage of GDP from 2010 to 2025 in the chart. whitehouse.gov
U.S. Department of the Treasury, Fiscal Data. Average Interest Rates on U.S. Treasury Securities. Source for the average interest rate on the Treasury’s interest-bearing debt in August 2021 and August 2026. fiscaldata.treasury.gov
U.S. Department of the Treasury. Notes to the FY 2025 Financial Statements, Note 12: Federal Debt and Interest Payable. Source for what debt held by the public is, who holds it, and gross federal debt as the sum of it and the debt held by government accounts such as trust funds. fiscal.treasury.gov
U.S. Department of the Treasury, Fiscal Data. America’s Finance Guide: Federal Spending. Source for what mandatory and discretionary spending are, and the words quoted about mandatory spending. fiscaldata.treasury.gov
Congressional Research Service. Emily M. McCabe and Cory R. Gill. Department of State, Foreign Operations, and Related Programs: FY2025 Budget and Appropriations. R48231, 16 October 2024. Source for what the international affairs budget function covers, foreign aid among it. everycrsreport.com
Committee for a Responsible Federal Budget. CBO’s February 2026 Budget and Economic Outlook. 11 February 2026. Source for the average deficit of 6.1% of GDP from 2027 to 2036, CRFB’s call to bring deficits toward 3% of GDP, its warning of a greater risk of a fiscal crisis, and the cuts the law calls for when a trust fund runs out. crfb.org
Centers for Medicare & Medicaid Services. National Health Expenditure fact sheet. Source for national health expenditure in 2024, $5.3 trillion or 18.0% of GDP, and the federal government’s 31% share of it. cms.gov
OECD. OECD Health Statistics 2026: health expenditure and financing, life expectancy, and maternal and infant mortality (OECD Data Explorer). Source for 2024 health spending per person and as a share of GDP, life expectancy at birth and infant deaths in the table, with the averages computed from the members’ figures. The definition of purchasing power parities is the OECD’s. oecd.org
Federal Ministry of Agriculture and Forestry, Climate and Environmental Protection, Regions and Water Management, Austria. Member states and partner countries of the OECD. Source for the OECD’s 38 members, whose figures make up the averages. bmluk.gv.at
Papanicolas I, Woskie LR, Jha AK. Health Care Spending in the United States and Other High-Income Countries. JAMA, 2018;319(10):1024–1039. Source for the comparison with ten high-income countries: similar use of care, more imaging, the shares overweight and smoking, generalist doctors’ pay, administrative costs on the narrower definition, and the authors’ conclusion on prices and administrative costs. doi.org
Himmelstein DU, Campbell T, Woolhandler S. Health Care Administrative Costs in the United States and Canada, 2017. Annals of Internal Medicine, 2020;172(2):134–142. Source for administration by insurers and providers at 34.2% of U.S. health spending in 2017, against 17.0% in Canada, in the kinds of spending whose administrative costs could be measured. doi.org
Mulcahy AW, Schwam D, Lovejoy SL. International Prescription Drug Price Comparisons: Estimates Using 2022 Data. RAND, for the Office of the Assistant Secretary for Planning and Evaluation, Department of Health and Human Services, February 2024. Source for RAND as a nonprofit research organization, and for U.S. prices for brand-name drugs at 422% of those in 33 other OECD countries, 308% after rebates, and for unbranded generics at 67%. aspe.hhs.gov
Congressional Budget Office, Single-Payer Health Care Systems Team. How CBO Analyzes the Costs of Proposals for Single-Payer Health Care Systems That Are Based on Medicare’s Fee-for-Service Program. Working Paper 2020-08, December 2020. Source for the five illustrative designs, the change in federal subsidies and in national health expenditures in 2030, the rise in the federal government’s share of health spending, and the factors behind them. cbo.gov
Liu JL, Brook RH. What is Single-Payer Health Care? A Review of Definitions and Proposals in the U.S. Journal of General Internal Medicine, 2017;32(7):822–831. Source for the usual definition of single-payer, the lack of an agreed one, and the 25 proposals reviewed, which differ widely. PubMed
HealthCare.gov. Glossary: Original Medicare. Source for Original Medicare as Medicare’s fee-for-service plan. healthcare.gov
Blahous C. The Costs of a National Single-Payer Healthcare System. Mercatus Working Paper, Mercatus Center, July 2018. Source for the estimate of $32.6 trillion in added federal budget commitments over 2022 to 2031. mercatus.org
Pollin R, Heintz J, Arno P, Wicks-Lim J, Ash M. Economic Analysis of Medicare for All. Political Economy Research Institute, University of Massachusetts Amherst, November 2018. Source for the estimated 9.6% fall in health consumption spending, the $5.1 trillion saved over 2017 to 2026, and the assumptions behind them. peri.umass.edu
U.S. Census Bureau. 2010 Census Shows 65 and Older Population Growing Faster Than Total U.S. Population. Release CB11-CN.192, 30 November 2011. Source for the 40.3 million people aged 65 and older in 2010. census.gov
U.S. Census Bureau. 2023 National Population Projections, main series, Table 2: Projected Population by Age Group and Sex. Source for the projected population aged 65 and older in 2030 and 2050. census.gov
Congressional Research Service. Social Security: Selected Findings of the 2026 Annual Report. IF13256, 25 June 2026. Source for the trustees’ projection that the retirement trust fund runs out in the fourth quarter of 2032, and for the long-range shortfall’s demographic cause. everycrsreport.com
National Committee to Preserve Social Security and Medicare. Viewpoint: Analysis of the 2026 Social Security Trustees Report. Source for the trustees’ count of about 2.6 covered workers for each Social Security beneficiary in 2025, as this analysis reports it. ncpssm.org
Committee for a Responsible Federal Budget. JCT Projects Tax Expenditures Will Be $2.3T in 2026. 9 February 2026. Source for the Joint Committee on Taxation’s projection of $2.3 trillion in tax expenditures in fiscal 2026, as CRFB reports it, and for CRFB’s description of what tax expenditures are. crfb.org
U.S. Department of the Treasury. General Explanations of the Administration’s Fiscal Year 2025 Revenue Proposals. 11 March 2024. Source for the proposal to raise the corporate income tax rate from 21% to 28% and its estimated $1.35 trillion over 2025 to 2034. home.treasury.gov
International Monetary Fund. World Economic Outlook database, general government gross debt (percent of GDP). Source for Japan’s gross government debt above 200% of GDP since 2013 and 214.5% in 2024, and the United States’ 122.3% in 2024. The figures are from the IMF’s data service; the link is to Japan’s series. imf.org
Cite this article
TruthBased.org. “Where Does U.S. Federal Spending Go?” Updated November 2026. https://www.truthbased.org/where-does-us-federal-spending-go