Economics & Policy
Where Does U.S. Federal Spending Go?
Where the $7.4 trillion of fiscal 2026 goes, and why interest now costs more than defense.
Economics & Policy
How Bad Is the National Debt?
What the debt figures measure, how the debt changed under each president, and what CBO projects next.
Economics & Policy
Do Tariffs Bring Back Manufacturing Jobs?
Four tariff episodes measured by jobs, prices, and downstream costs.
What Causes Inflation?
U.S. consumer prices rose 9.1% in the year to June 2022, the largest 12-month rise since 1981, and inflation rose again in 2026. Two explanations are common: that government spending caused it, and that supply chains did. This page tests both against U.S. price data from 2020 to August 2026, eight other economies and the Federal Reserve’s response.
Jump to the verdict ↓
The short answer
Supply and demand together, in shares research has not settled. In 2021 and 2022, pandemic shortages and then the energy shock after Russia invaded Ukraine raised prices in the U.S. and abroad alike. U.S. relief spending added to demand, and estimates of its effect on inflation run from about 0.3 to 3 percentage points. In 2026 inflation rose again when energy prices jumped, while consumer price index inflation outside food and energy stayed below 3%.
The Inflation Timeline (2020–2026)
The consumer price index for all urban consumers (CPI-U) rose 9.1% in the 12 months to June 2022, the largest 12-month increase since November 1981. The Bureau of Labor Statistics (BLS) publishes it. The rate fell to 2.4% in January and February 2026, then rose to 4.2% in May 2026 as energy prices jumped. In August 2026, the latest month published, it was 3.4%. Core inflation, which leaves out food and energy, was 2.4%.
CPI monthly data: rise and fall
U.S. Inflation Milestones
Year-over-year % change
January 2020 (pre-pandemic baseline)2.5%
May 2020 (the pandemic low)0.1%
March 2021 (American Rescue Plan signed on 11 March)2.6%
December 20217.0%
June 2022 (peak)9.1%, highest since 1981
December 20226.5%
December 20233.4%
February 20262.4% headline / 2.5% core
May 2026 (energy prices up 23.5% on a year earlier)4.2%
August 2026 (latest)3.4% headline / 2.4% core
Personal consumption expenditures (PCE), August 2026 (the measure the Fed targets)3.4% headline / 3.0% core
| Year | Jan | Feb | Mar | Apr | May | Jun | Jul | Aug | Sep | Oct | Nov | Dec |
|---|---|---|---|---|---|---|---|---|---|---|---|---|
| 2020 | 2.5 | 2.3 | 1.5 | 0.3 | 0.1 | 0.6 | 1.0 | 1.3 | 1.4 | 1.2 | 1.2 | 1.4 |
| 2021 | 1.4 | 1.7 | 2.6 | 4.2 | 5.0 | 5.4 | 5.4 | 5.3 | 5.4 | 6.2 | 6.8 | 7.0 |
| 2022 | 7.5 | 7.9 | 8.5 | 8.3 | 8.6 | 9.1 | 8.5 | 8.3 | 8.2 | 7.7 | 7.1 | 6.5 |
| 2023 | 6.4 | 6.0 | 5.0 | 4.9 | 4.0 | 3.0 | 3.2 | 3.7 | 3.7 | 3.2 | 3.1 | 3.4 |
| 2024 | 3.1 | 3.2 | 3.5 | 3.4 | 3.3 | 3.0 | 2.9 | 2.5 | 2.4 | 2.6 | 2.7 | 2.9 |
| 2025 | 3.0 | 2.8 | 2.4 | 2.3 | 2.4 | 2.7 | 2.7 | 2.9 | 3.0 | n/a | 2.7 | 2.7 |
| 2026 | 2.4 | 2.4 | 3.3 | 3.8 | 4.2 | 3.5 | 3.4 | 3.4 | – | – | – | – |
How to read it: the line is the percent change in U.S. consumer prices (CPI-U, all items) from the same month a year earlier. It covers every month from January 2020 to August 2026. The gap is October 2025, for which BLS published no figure. The table above gives every value. Source: Bureau of Labor Statistics.
The Federal Reserve’s 2% inflation goal is measured with a different index, the PCE price index from the Bureau of Economic Analysis. The two indexes use different formulas: a Fisher formula for the PCE index and a modified Laspeyres formula for the CPI. They also weight items differently. And the PCE index counts spending made on households’ behalf as well as their own, including Medicare and Medicaid payments to health care providers.
In August 2026 both headline measures were up 3.4% on a year earlier. Core inflation was 3.0% on the PCE measure, against 2.4% on the CPI.
What Drove the Rise
The rise began in goods. During the pandemic, spending moved from services to goods. By spring 2021, Americans’ spending on goods was about 10% above its pre-pandemic trend, and spending on services about 5% below it. So finds a 2025 Federal Reserve review of the episode by Ina Hajdini, Adam Shapiro, A. Lee Smith and Daniel Villar. Pandemic limits on supply still held, so inventories ran out, delivery times lengthened and goods prices rose.
Shortages hit inputs such as semiconductors, and markets for new and used vehicles were unusually distorted. Used car and truck prices rose 45.2% in the 12 months to June 2021 (BLS). The New York Fed’s Global Supply Chain Pressure Index, which combines supply chain indicators, peaked in December 2021, four standard deviations above its historical average.
Fiscal support added to the demand for goods. Comparing countries, Federal Reserve economists found that more generous fiscal support went with stronger spending on goods but not with more production (de Soyres, Santacreu and Young, 2022).
Energy: the 2022 accelerationEnergy prices gave a second push after Russian forces invaded Ukraine on 24 February 2022. Brent crude oil averaged $86.51 a barrel in January 2022 and $122.71 in June, according to the U.S. Energy Information Administration (EIA). U.S. regular gasoline averaged $5.006 a gallon in the week of 13 June 2022, its peak. The World Bank’s European natural gas price, from a Dutch trading hub, averaged $40.34 per million British thermal units in 2022, against $16.12 in 2021.
Within the consumer price index (CPI), the energy index rose 41.6% in the 12 months to June 2022. On BLS’s weights, that rise accounts for about 3 of the 9.1 percentage points. By December 2022 the energy index was 19% below its June level. Its rise over 12 months had slowed to 7.3%. Energy costs also pass through to other prices over time.
Energy again in 2026In 2026 another energy shock hit. Military action in the Middle East on 28 February stopped most shipping through the Strait of Hormuz (EIA). Brent crude averaged $117.29 a barrel in April, against $70.89 in February (EIA). The CPI’s energy index was 23.5% higher in May 2026 than a year earlier, and all-items inflation reached 4.2%. Core inflation stayed between 2.4% and 2.9% from January to August 2026.
Fiscal stimulus: the demand contributionCongress passed three large relief packages between March 2020 and March 2021. In a 2023 paper on the pandemic-era inflation, Ben Bernanke and Olivier Blanchard give their headline costs as follows.
| Package | Signed | Headline cost |
|---|---|---|
| CARES Act | March 2020 | $2.2 trillion |
| December 2020 package (covid relief) | December 2020 | $900 billion |
| American Rescue Plan | March 2021 | $1.9 trillion |
A 2025 Federal Reserve study of the international experience, by Anna Lipińska, Enrique Martínez García and Felipe Schwartzman, draws on International Monetary Fund estimates. On those estimates, it puts U.S. support from January 2020 to September 2021 at about 25% of gross domestic product. That was “substantially larger than the fiscal support provided abroad”.
Estimates of what relief spending added to inflation differ about tenfold. The San Francisco Fed (Jordà, Liu, Nechio and Rivera-Reyes, 2022) put U.S. fiscal support’s effect at about 3 percentage points of core CPI inflation by the end of 2021. It added that this was “estimated with considerable uncertainty because the available sample is too short”.
A Federal Reserve Board note (de Soyres, Santacreu and Young, 2022) looked at the rise in U.S. inflation above its 2015–2019 average by the end of 2021. It linked domestic stimulus with about 2.5 points of that rise, and 1.8 points in the euro area. It called its results illustrative, “highlighting perhaps the higher end of potential price pressures”.
At the low end, Barnichon, Oliveira and Shapiro (2021) studied the American Rescue Plan alone, working through the labor market. They estimated it would raise core personal consumption expenditures (PCE) inflation by about 0.3 point a year through 2022. The Fed’s 2025 review finds “little apparent consensus” on what fiscal and monetary policy contributed.
Supply or demand?Studies also disagree on how much of the rise came from supply and how much from demand. The Fed’s 2025 review finds “no consensus on the relative importance of each”. In the San Francisco Fed’s split of 12-month PCE inflation, the supply-driven part peaked at 3.4 percentage points in June 2022. The demand-driven part peaked at 2.9 points in October 2022.
Inflation rose across rich countries in the same period, which points to shocks that crossed borders. The Fed’s international study finds that the surge “was set in motion by two global events”, the pandemic and Russia’s invasion of Ukraine.
But the same study also finds that U.S. inflation rose earlier, “likely due to an earlier reopening and larger fiscal support to income”. Countries with bigger pandemic stimulus had bigger rises in core prices from 2019 to 2023, a correlation other studies say may not show the true effect.
Which Prices Are Still Rising
Shelter made up 35.6% of the consumer price index (CPI) basket in December 2025, by BLS’s relative importance weights. Its rise over 12 months slowed from a peak of 8.2% in March 2023 to 3.0% in August 2026.
By contrast, in August 2026 energy was the fastest-rising group, up 16.3% on a year earlier, “due in large part to the index for gasoline rising 27.4 percent” (BLS).
| Part of the CPI | Share of the basket, December 2025 | Change in the 12 months to August 2026 |
|---|---|---|
| All items | 100% | 3.4% |
| Shelter | 35.6% | 3.0% |
| Food at home | 8.3% | 2.2% |
| Food away from home | 5.4% | 3.4% |
| Energy | 6.4% | 16.3% |
| Goods other than food and energy | 19.2% | 0.7% |
| Services other than energy services (shelter included) | 60.7% | 3.0% |
Housing costs in the CPI move slowly. For homes their owners live in, the CPI measures owners’ equivalent rent, “the implicit rent that owner occupants would have to pay if they were renting their homes, without furnishings or utilities”. BLS prices it from a sample of rented homes and collects each home’s rent every six months, so the index follows the rents all tenants pay, not only new leases.
Rents for new tenants move first. Rent inflation for new tenants leads the official BLS rent inflation by four quarters. So finds a study of BLS rent records published by the Cleveland Fed and BLS (Adams, Loewenstein, Montag and Verbrugge, 2022). Market rent growth returned to pre-pandemic levels in 2022, but CPI rent inflation “remained stubbornly high for years”, as existing leases slowly caught up to market rents (Hajdini and colleagues).
The wage-price spiral questionThere was little evidence of a wage-price spiral. In such a spiral, wages rise in response to prices and then push prices higher again. Pay fell behind prices: real average hourly earnings of private-sector workers fell from $11.40 in February 2021 to $10.91 in June 2022, in 1982–84 dollars (BLS). Bernanke and Blanchard find that tight labor markets were not the main driver of the 2021–2022 rise, though their effects on inflation last longer than those of price shocks.
Real earnings have stayed above their February 2020 level, $11.01, since March 2023, when inflation was falling. The Fed’s international study finds that the recovery in real wages, as nominal wages grew faster than prices, “likely contributed to the persistence of inflation”.
International Comparison
| Economy | Peak | Month of peak | August 2026 |
|---|---|---|---|
| Germany | 11.6% | Oct 2022 | 2.9% |
| United Kingdom | 11.1% | Oct 2022 | 3.1% |
| Sweden | 10.8% | Dec 2022 | 0.3% |
| Euro area | 10.6% | Oct 2022 | 3.2% |
| United States | 9.1% | Jun 2022 | 3.4% |
| Australia | 8.4% | Dec 2022 | 4.0% |
| Canada | 8.1% | Jun 2022 | 3.0% |
| New Zealand | 7.3% | Jun quarter 2022 | 4.1% (Jun quarter 2026) |
| Japan | 4.3% | Jan 2023 | 1.9% |
All nine economies in the table peaked between June 2022 and January 2023. The United States, Canada and New Zealand peaked first, in June 2022.
The European economies peaked later and higher. The Fed’s international study attributes this “mainly” to “the larger exposure of European economies to cuts in energy supply from Russia”. However, Germany’s national consumer price index peaked lower than its harmonised index, at 8.8% in October 2022, below the U.S. peak. Japan’s peak, 4.3% in January 2023, was the lowest of the nine.
The 2026 oil shock raised inflation abroad too. In the euro area, inflation rose from 1.9% in February 2026 to 3.2% in August. In August, energy prices there were 14.3% higher than a year earlier.
How to read it: for each economy, the left bar is its peak 12-month inflation between 2021 and 2023, and the right bar its 12-month inflation in August 2026. For New Zealand, the bars are the June quarters of 2022 and 2026. The table above gives the same values, months and measures. Sources: Eurostat, Office for National Statistics, Bureau of Labor Statistics, Australian Bureau of Statistics, Statistics Canada, Stats NZ, Statistics Bureau of Japan.
The Federal Reserve Response
Inflation began rising in the spring of 2021, but the Fed held its policy rate, the federal funds rate, at 0–0.25% until March 2022. In April 2021 the committee that sets the rate put the rise down to “transitory factors”. It dropped the word “transitory” only in December 2021. A 2024 Federal Reserve note by Jane Ihrig and Chris Waller recounts both decisions. Bernanke and Blanchard write that policymakers in the United States and other advanced economies “were accordingly slow to react”.
From March 2022 to July 2023 the Fed raised the rate by 5.25 percentage points, to 5.25–5.5%. Ihrig and Waller call it “much faster tightening of policy than had been seen in more than 30 years”. The average 30-year fixed mortgage rate rose from 3.22% in the first week of January 2022 to a peak of 7.79% in the week of 26 October 2023 (Freddie Mac).
Federal Reserve Rate Cycle
2021–2026
January 20210–0.25%
First riseMarch 2022 (+0.25 point)
Peak5.25–5.5% (July 2023)
Total rise525 basis points in 16 months
First cutSeptember 2024 (−0.5 point)
December 2025, after six cuts3.5–3.75%
September 2026 (latest change)3.75–4% (+0.25 point)
Partly, though how much is hard to measure. The Fed’s 2025 review finds that “Monetary policy tightening and a fading of fiscal support reduced demand, while a healing of supply chains, strong productivity growth, and an increase in the labor force helped expand supply.” It adds that monetary policy helped keep longer-term inflation expectations “generally well anchored”. By June 2023 the consumer price index’s rise over 12 months was down to 3.0%.
One estimate of the Fed’s share comes from Rami Najjar and Adam Shapiro of the San Francisco Fed (2025). They find that without the rate rises of 2022 and 2023, core personal consumption expenditures inflation “would have been approximately 3 percentage points higher on average between 2022 and 2024”. They add that “Easing labor shortages, dissipating supply chain bottlenecks, and the fading effects of fiscal stimulus also likely played crucial roles.”
Steelmanning Both Sides
Before the $1.9 trillion American Rescue Plan was signed in March 2021, Olivier Blanchard warned that it could overheat the economy. Working from the Congressional Budget Office’s estimate of potential growth, he put the output gap at about $900 billion at the end of 2020. The output gap is the shortfall of output below what the economy could produce.
If each dollar of relief spending added a dollar of demand, the American Rescue Plan and the December 2020 package together would add $2.8 trillion. That is “nearly 3 times an overly generous estimate of the output gap”, Blanchard wrote.
Bernanke and Blanchard report that Lawrence Summers also argued in 2021 that inflation could rise much more than conventional calculations predicted.
U.S. inflation also rose before inflation abroad did, likely due in part to larger fiscal support, and the Fed held its rate near zero until March 2022. Ihrig and Waller consider guidance like the Fed’s of December 2012. Under it, they write, the conditions for a first rise “would have been met in the spring of 2021”, about a year earlier.
Against this, estimates of what relief spending added run from about 0.3 to 3 points. The two highest, from the San Francisco Fed and a Federal Reserve Board note, carry their authors’ warnings. The United Kingdom, Sweden and the euro area gave less fiscal support yet peaked higher, mainly because of Russian energy cuts, the Fed’s international study finds. And in 2026 U.S. inflation rose again after an energy shock, while core consumer price index inflation stayed below 3%.
The strongest case that supply shocks were primaryAll nine economies in the international comparison peaked within seven months of each other, after the pandemic and Russia’s invasion of Ukraine. The Fed’s international study uses a model that relates core inflation to expected inflation, spare capacity and supply factors. It suggests the 2021–22 surge was “mainly driven by ‘cost push’ factors, such as supply shortages and relative price shifts”.
Against this, the same study warns that if its supply measures were partly driven by demand, its estimate of demand’s part “should be viewed as a lower bound”. Bernanke and Blanchard conclude that excessive demand “set off the inflation” but did so mainly through price shocks. In their account, excessive demand raised commodity prices, which the war in Ukraine also pushed up, and the demand for goods whose supply could not keep up.
The verdict: what the evidence shows
Supply and demand together. No single cause fits the record of 2021 and 2022. Inflation rose in the U.S. and abroad in the same period, after the same global shocks, and European economies with less fiscal support peaked higher. Yet U.S. inflation also rose earlier, likely due in part to larger fiscal support, and estimates of what relief spending added run from about 0.3 to 3 percentage points. The San Francisco Fed’s split puts the peaks of supply-driven and demand-driven inflation at 3.4 and 2.9 points.
Rate rises helped bring inflation down, together with healing supply chains, though how much each did is hard to measure. In 2026 an energy shock raised inflation again while core consumer price index inflation stayed below 3%.
Four common claims, against the evidence
Claim“Government spending caused inflation.”
PartlyU.S. relief spending added to demand, and estimates of its effect on inflation run from about 0.3 to 3 percentage points. Inflation also rose, and peaked higher, in European economies with less fiscal support.
Claim“It was supply chains, not spending.”
PartlyPandemic shortages and the 2022 energy shock raised prices in the U.S. and abroad alike. The Fed’s 2025 review finds no consensus on how much of the rise came from supply and how much from demand.
Claim“Greedflation: companies used inflation as cover to raise prices.”
Not a main driverSan Francisco Fed economists found that markups rose sharply in some industries, such as motor vehicles and petroleum. Markups across the economy stayed generally flat and were “not a main driver” of inflation’s rise and fall.
Claim“The Fed caused inflation by printing money.”
DisputedThe Fed’s 2025 review reports two studies. One finds that the Fed’s shift to easy policy explains half of the rise in inflation after 2020; another finds a much smaller role.
Download the conclusion
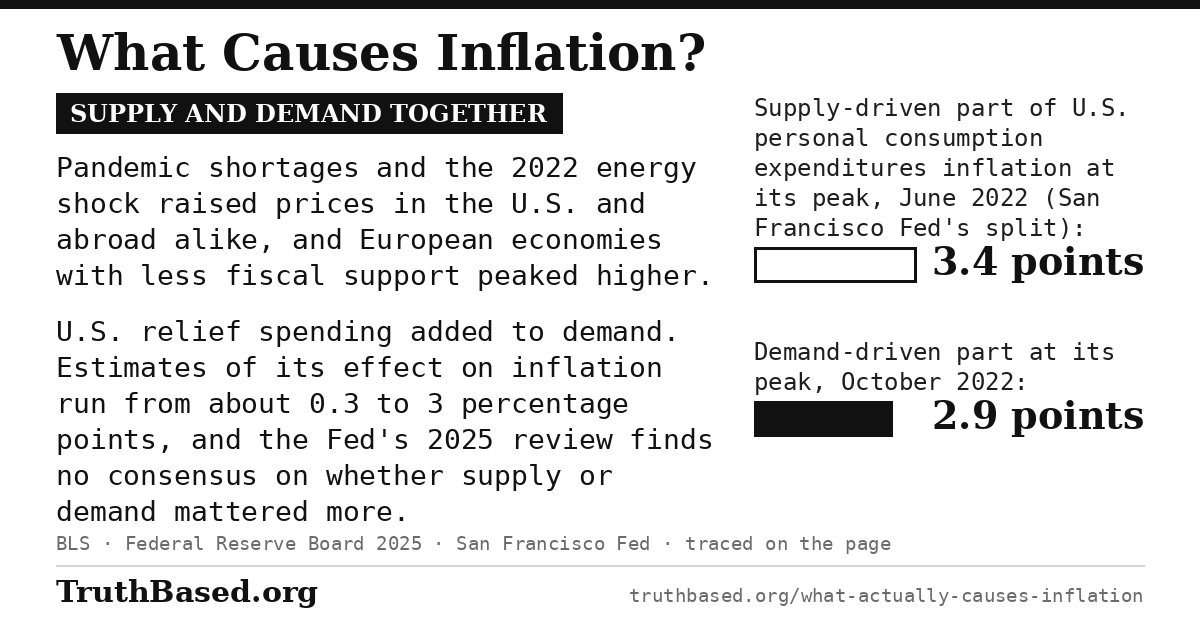
The verdict above as one image, with the two numbers that frame it. They are the peaks of the supply-driven and demand-driven parts of U.S. personal consumption expenditures (PCE) inflation in the San Francisco Fed’s split. The supply-driven part peaked at 3.4 percentage points in June 2022, the demand-driven part at 2.9 in October 2022. The image is 1,200 by 630 pixels, the size social networks use for link previews, and anyone may download it and post it.
What would change this conclusion
This article concludes that:
- U.S. inflation peaked at 9.1% in June 2022 and rose again in 2026 after an energy shock;
- supply shocks and demand both drove the rise of 2021 and 2022, in shares research has not settled;
- estimates of what U.S. relief spending added to inflation run from about 0.3 to 3 percentage points;
- shelter inflation lagged market rents and slowed to 3.0% by August 2026;
- wages did not drive the surge in a wage-price spiral;
- rate rises helped bring inflation down, together with healing supply chains.
These conclusions would be falsified by:
• A split of U.S. inflation into supply and demand parts, by the San Francisco Fed or other researchers, giving one of them nearly all of the 2021–2022 rise. Other methods would have to bear it out.
• Cross-country studies finding that, once exposure to energy prices is allowed for, inflation rose no more where fiscal support was larger
• Wage data showing that U.S. pay rose faster than prices through 2021 and 2022
Sources
U.S. Bureau of Labor Statistics. Consumer Price Index for All Urban Consumers (CPI-U), U.S. city average, not seasonally adjusted: all items; all items less food and energy; energy; shelter; food at home; food away from home; commodities less food and energy commodities; services less energy services; used cars and trucks. 12-month percent changes, January 2020 to August 2026. Source for every monthly CPI figure on the page, the monthly table and chart, the components table’s changes, shelter’s peak, and the used car and truck rise to June 2021. data.bls.gov
U.S. Bureau of Labor Statistics. Consumer Price Index news release, June 2022 (13 July 2022). Source for the 9.1% rise being the largest 12-month increase since the period ending November 1981. bls.gov
U.S. Bureau of Labor Statistics. Consumer Price Index news release, August 2026 (11 September 2026). Source for the August 2026 figures and for the energy index’s 16.3% rise, “due in large part” to gasoline. bls.gov
U.S. Bureau of Labor Statistics. Relative importance of components in the Consumer Price Indexes, December 2020 and December 2025. Source for energy’s weight, used to compute its share of the June 2022 peak, and for the December 2025 shares in the components table. bls.gov
U.S. Bureau of Labor Statistics. Measuring Price Change in the CPI: Rent and Rental Equivalence. Source for the definition of owners’ equivalent rent and the collection of each sampled home’s rent every six months. bls.gov
U.S. Bureau of Labor Statistics. Current Employment Statistics: average hourly earnings of all employees, total private, in 1982–84 dollars (series CES0500000013). Source for real average hourly earnings in February 2020, February 2021, June 2022 and March 2023. data.bls.gov
U.S. Bureau of Economic Analysis. Personal Income and Outlays, August 2026 (30 September 2026). Source for the PCE price index’s rise of 3.4%, and 3.0% excluding food and energy, in the 12 months to August 2026. bea.gov
U.S. Bureau of Economic Analysis. What accounts for the differences in the PCE price index and the Consumer Price Index? FAQ 555. Source for the two indexes’ formulas, weights and scope. bea.gov
Federal Open Market Committee. Statement on Longer-Run Goals and Monetary Policy Strategy (reaffirmed January 2026). Source for the 2% inflation goal, measured by the PCE price index. federalreserve.gov
Hajdini I, Shapiro A, Smith AL, Villar D. Inflation since the Pandemic: Lessons and Challenges. Finance and Economics Discussion Series 2025-070. Federal Reserve Board, 2025. Source for the Medicare and Medicaid payments the PCE index includes, the shift of spending to goods and its size, the supply limits, the supply chain index’s peak, “little apparent consensus” on fiscal and monetary policy’s part, “no consensus” on supply and demand, rents that “remained stubbornly high for years”, the start of the rise in spring 2021, its account of the fall in inflation and of expectations, and the two studies of the Fed’s policy it reports. federalreserve.gov
Federal Reserve Bank of San Francisco. Supply- and Demand-Driven PCE Inflation, updated 30 September 2026: Figure 3, contributions to year-over-year headline PCE inflation. Source for the supply-driven and demand-driven parts of U.S. PCE inflation and their peaks: 3.4 percentage points in June 2022 and 2.9 in October 2022. frbsf.org
Lipińska A, Martínez García E, Schwartzman F. Pandemic and War Inflation: Lessons from the International Experience. Finance and Economics Discussion Series 2025-071. Federal Reserve Board, August 2025. Source for the two global events, U.S. fiscal support of about 25% of GDP on IMF figures and its size against support abroad, the earlier U.S. rise, the correlation of stimulus with core price rises, the later and higher European peaks, the role of real wages, the cost-push finding with its lower-bound warning, and the time energy prices take to pass through to core prices. federalreserve.gov
Blanchard OJ, Bernanke BS. What Caused the US Pandemic-Era Inflation? NBER Working Paper 31417, June 2023; published in American Economic Journal: Macroeconomics, 2025. Source for the relief packages’ headline costs, the unusual distortions in markets for new and used vehicles, the finding that tight labor markets were not the main driver, policymakers’ slow reaction, Lawrence Summers’s 2021 warning as they report it, and their conclusion that excessive demand set off the inflation mainly through price shocks. nber.org
Jordà Ò, Liu C, Nechio F, Rivera-Reyes F. Why Is U.S. Inflation Higher than in Other Countries? FRBSF Economic Letter 2022-07, 28 March 2022. Source for the estimate of about 3 percentage points of core CPI inflation from U.S. fiscal support by the end of 2021, and its warning about uncertainty. frbsf.org
de Soyres F, Santacreu AM, Young H. Fiscal policy and excess inflation during Covid-19: a cross-country view. FEDS Notes, Federal Reserve Board, 15 July 2022. Source for fiscal support’s link with spending on goods, and for the estimates of 2.5 percentage points in the U.S. and 1.8 in the euro area, with the note’s caveat. federalreserve.gov
Barnichon R, Oliveira LE, Shapiro AH. Is the American Rescue Plan Taking Us Back to the ’60s? FRBSF Economic Letter 2021-27, 18 October 2021. Source for the estimate of about 0.3 percentage point a year through 2022. frbsf.org
Blanchard O. In defense of concerns over the $1.9 trillion relief plan. RealTime Economics, Peterson Institute for International Economics, 18 February 2021. Source for the output gap of about $900 billion worked from the Congressional Budget Office’s estimate of potential growth, and the $2.8 trillion of the two packages as “nearly 3 times” it. piie.com
U.S. Congress. American Rescue Plan Act of 2021, Public Law 117-2, 11 March 2021. Source for the date the act became law. govinfo.gov
Benigno G, Di Giovanni J, Groen J, Noble A. Global Supply Chain Pressure Index: March 2022 Update. Liberty Street Economics, Federal Reserve Bank of New York, 3 March 2022. Source for the index’s peak in December 2021. libertystreeteconomics.newyorkfed.org
U.S. Energy Information Administration. Europe Brent Spot Price FOB, monthly; Weekly U.S. Regular All Formulations Retail Gasoline Prices. Source for Brent’s monthly averages in January and June 2022 and in February and April 2026, and for gasoline’s peak week in June 2022. eia.gov; eia.gov
U.S. Energy Information Administration. Crude oil prices rise above $100 per barrel after Russia’s further invasion into Ukraine. Today in Energy, 4 March 2022, republished 19 December 2022. Source for the date of the invasion. eia.gov
U.S. Energy Information Administration. Crude oil and petroleum product prices increased sharply in the first quarter of 2026. Today in Energy, 7 April 2026. Source for the military action of 28 February 2026 and the halt to most shipping through the Strait of Hormuz. eia.gov
World Bank. Commodities Price Data (The Pink Sheet), 5 September 2023: annual averages. Source for the European natural gas price in 2021 and 2022. thedocs.worldbank.org
Adams B, Loewenstein L, Montag H, Verbrugge RJ. Disentangling Rent Index Differences: Data, Methods, and Scope. Federal Reserve Bank of Cleveland Working Paper 22-38, December 2022; also BLS Economic Working Paper 555. Source for new tenants’ rent inflation leading the official rent index by four quarters. clevelandfed.org
Leduc S, Li H, Liu Z. Are Markups Driving the Ups and Downs of Inflation? FRBSF Economic Letter 2024-12, 13 May 2024. Source for the markups in motor vehicles and petroleum, flat markups across the economy, and the finding that markups were not a main driver. frbsf.org
Eurostat. Harmonised index of consumer prices (HICP), monthly data, annual rate of change (datasets prc_hicp_minr and prc_hicp_manr). Source for the figures for the euro area, Germany and Sweden, and for euro area energy prices. ec.europa.eu
Office for National Statistics. CPI annual rate: all items (series D7G7). Source for the United Kingdom’s figures. ons.gov.uk
Statistics Canada. Table 18-10-0004-01, Consumer Price Index, monthly, not seasonally adjusted. Source for Canada’s figures, computed from the published all-items index. statcan.gc.ca
Australian Bureau of Statistics. Monthly Consumer Price Index Indicator, December 2022 and December 2023; Consumer Price Index, Australia, August 2026. Source for Australia’s peak and its August 2026 figure. abs.gov.au
Stats NZ. Annual inflation at 7.3 percent, 32-year high (18 July 2022); Annual inflation at 4.1 percent in June 2026 (21 July 2026). Source for New Zealand’s quarterly figures. stats.govt.nz
Statistics Bureau of Japan. Consumer Price Index, Japan: 2020-base monthly indexes, and the August 2026 release. Source for Japan’s figures, its peak computed from the published index. stat.go.jp
OECD. Consumer price indices (CPIs, HICPs), COICOP 1999: Germany, national consumer price index, growth over one year, monthly, 2022 (OECD Data API). Source for Germany’s national CPI peak of 8.8% in October 2022. sdmx.oecd.org
Ihrig J, Waller C. The Federal Reserve’s responses to the post-Covid period of high inflation. FEDS Notes, Federal Reserve Board, 14 February 2024. Source for the “transitory” wording and its removal, the pace of the tightening, and the earlier first rise under December 2012-style guidance. federalreserve.gov
Federal Reserve Board. Open Market Operations: the FOMC’s target range for the federal funds rate, changes and levels, 2003 to 2026. Source for every rate in the Federal Reserve table. federalreserve.gov
Federal Reserve Board. Federal Reserve issues FOMC statement, 16 September 2026. Source for the rise of a quarter point to 3.75–4%. federalreserve.gov
Najjar R, Shapiro AH. Does Monetary Policy Tightening Reduce Inflation? FRBSF Economic Letter 2025-03, 3 February 2025. Source for the estimate that core PCE inflation would have been about 3 percentage points higher on average from 2022 to 2024 without the rate rises, and for the other factors it names. frbsf.org
Freddie Mac. Primary Mortgage Market Survey: weekly average 30-year fixed rate. Source for the rates of 3.22% in the first week of January 2022 and 7.79% in the week of 26 October 2023. freddiemac.com
Cite this article
TruthBased.org. “What Causes Inflation?” Updated October 2026. https://www.truthbased.org/what-actually-causes-inflation