Economics & Policy
U.S. Federal Spending: What We Spend and What It Costs
The budget by function, traced to the Treasury and CBO tables.
Economics & Policy
The National Debt: What Both Parties Actually Did
Debt, deficits and interest costs against the historical record.
Economics & Policy
The Gender Wage Gap: What the Data Actually Shows
Raw gap, adjusted gap, and what the adjustments do.
Do the Richest Americans Pay Less Tax Than Everyone Else?
The top 1 percent paid 26 percent of the income they reported in 2023. Taxpayers as a whole paid 14 percent. The 400 richest families paid about 8 percent once the rise in value of stock they never sold was counted as income. Whether the rich pay less than everyone else turns on one question, what counts as income, and the data cannot settle that question. It can only show what each answer looks like.
Jump to the verdict ↓
What this covers
Federal taxes in the United States, with a section on state and local taxes. The income measures are the ones the IRS, the Congressional Budget Office, the White House Council of Economic Advisers, ProPublica and the economists Emmanuel Saez and Gabriel Zucman actually used, each named where it appears. The page does not decide whether the rich should pay more. It shows what they pay under each definition of income and where the definitions part company.
The short answer
It depends on what you count as income, and the two answers do not meet.
On the income people report to the IRS, the richest pay the highest rates. In 2023 the top 1 percent paid an average federal income tax rate of 26.3 percent, taxpayers as a whole paid 14.1 percent, and the bottom half paid 3.7 percent. The top 1 percent earned 20.6 percent of all reported income and paid 38.4 percent of all federal income tax. Add payroll, corporate and excise taxes, as the Congressional Budget Office does, and the top 1 percent paid 29.8 percent of their income in federal taxes in 2021 against 17.4 percent for all households.
Count the gains on assets that were never sold, and the picture reverses at the very top. The White House Council of Economic Advisers estimated that the 400 wealthiest families paid 8.2 percent in federal individual income tax over 2010 to 2018 once the growth in their Forbes-estimated wealth was treated as income. ProPublica, dividing the taxes of the 25 richest Americans by the growth in their fortunes, got 3.4 percent. Those figures are also correct on their own terms. Their denominators are not the same as the IRS’s, and neither of them counts the corporate tax paid on the same profits.
The claim “the rich pay less than everyone else” is false for the top 1 percent on every measure that uses income actually received. It is true for the few hundred richest families if the rise in value of unsold stock is income. No dataset decides which definition is right.
Two answers, and why both are correct
Ask how much tax someone pays and you need two numbers: what they paid and what you divide it by. Everyone agrees on the first. Federal individual income tax is recorded on returns, and the IRS publishes it by income group every year. The fight is about the second number.
The IRS divides by adjusted gross income, the income on the tax return: wages, interest, dividends, business profits and the gains on assets sold that year. The Congressional Budget Office uses a broader measure, adding the employer share of payroll taxes, employer-paid health insurance and a share of corporate profits, and it counts payroll, corporate and excise taxes as well as income tax. Both measures have one thing in common. Stock that rose in value and was not sold is not income in either. Nobody has received anything, so nothing is taxed, and the rise appears in no denominator.
For most people that omission changes little. Their income is wages, and wages are taxed as they arrive. For the few hundred richest Americans it changes everything, because most of what they gain each year is the rising value of companies they own and do not sell. Jeff Bezos’s Amazon salary was about $80,000 a year, ProPublica reported. Between 2006 and 2018 he reported $6.5 billion of income and paid $1.4 billion in federal income tax, about 21 percent. Over the same years his wealth rose by $127 billion. Divide the same $1.4 billion by that and the rate is 1.1 percent.
The chart shows the richest Americans, defined four different ways and measured four different ways. Nothing in it is in dispute except which bar to look at.
The same question, four denominators
How to read it: each bar is an average federal tax rate in percent for the top group, and the four bars answer the same question with four different definitions of income. The top two (26.3 and 29.8) divide tax by income reported to the IRS; the bottom two (8.2 and 3.4) divide by a measure that includes gains on assets not sold. The gap between the pairs is the whole argument.
Sources: IRS Statistics of Income, tax year 2023; CBO, The Distribution of Household Income in 2021; White House CEA, September 2021; ProPublica, June 2021. Each figure is described in full in the sections below.
A note on the word “rich”
The groups in the chart are not the same size. The top 1 percent of tax returns in 2023 was 1.53 million returns with adjusted gross income of $675,602 or more. The top 0.001 percent was 1,531 returns above $78.6 million. The CEA’s group was 400 families ranked by wealth, most of them billionaires. ProPublica’s was 25 people. A statement about “the rich” that is true of 1.5 million households can be false of 400, and the reverse. Most of the confusion in this debate comes from sliding between them.
What the richest pay on the income they report
The IRS Statistics of Income division publishes federal individual income tax by income percentile each year. The latest tables cover tax year 2023, published in 2026. They count 153.1 million returns, $15.2 trillion of adjusted gross income and $2.14 trillion of income tax. The figures below are those tables as compiled by the Tax Foundation, which reproduces the IRS cells with the same definitions; the IRS file itself is a spreadsheet, linked in the sources.
Average federal income tax rate by income group, 2023
How to read it: each bar is the average federal income tax rate paid by that slice of taxpayers in 2023, from the bottom half (3.7%) and all taxpayers together (14.1%) through the top 25% (17.8%), the top 10% (20.9%) and the top 5% (23.0%) to the top 1% (26.3%), with the top 0.001%, the 1,531 richest returns, at 23.6%. Federal individual income tax after credits, divided by adjusted gross income; refundable credits paid out as cash are excluded, which raises the bottom group’s rate slightly.
Source: IRS Statistics of Income, individual returns by percentile, tax year 2023, via the Tax Foundation compilation of 15 April 2026.
The rates rise with income until the last step. The bottom half of taxpayers, everyone reporting less than $53,801, paid 3.7 percent. The top 1 percent paid 26.3 percent, seven times that. Then the line bends. The 1,531 returns in the top 0.001 percent, all above $78.6 million, paid 23.6 percent, less than the top 1 percent as a whole. The reason is the composition of their income. Wages are taxed at up to 37 percent. Long-term capital gains and dividends are taxed at a top rate of 20 percent, or 23.8 percent with the surtax on investment income, and the very richest earn most of their reported income that way.
Shares tell the same story from the other side. The top 1 percent reported 20.6 percent of all adjusted gross income and paid 38.4 percent of all federal income tax, $823 billion. The bottom half reported 12.3 percent of income and paid 3.3 percent of the tax. The top 1 percent’s 1.5 million returns paid almost as much as the bottom 95 percent’s 145 million returns put together.
IRS Statistics of Income, tax year 2023
153.1 million returns, dependents excluded
Top 1 percent: share of income / share of income tax20.6% / 38.4%
Top 1 percent: average rate26.3% on AGI of $675,602 and above
Top 0.001 percent: average rate23.6% on AGI above $78.6 million, 1,531 returns
All taxpayers: average rate14.1%
Bottom 50 percent: share of income / share of tax / rate12.3% / 3.3% / 3.7%
Income tax paid by the top 1 percent$823 billion of $2.14 trillion
Two things this table leaves out. It covers the individual income tax only, which was 49 percent of federal receipts in fiscal 2024 ($2.43 trillion of $4.92 trillion, Treasury). Payroll taxes, the next largest source, fall on wages, which is why Buffett could write in 2011 that the mega-rich “pay practically nothing in payroll taxes” while the middle class is “hit with heavy payroll taxes to boot.” And the income measure excludes government transfers, employer health insurance and, the item that matters here, any gain on an asset not sold.
Counting every federal tax
The Congressional Budget Office answers the payroll objection. Its report on the distribution of household income in 2021, published in September 2024, allocates four federal taxes to households: individual income, payroll (both the employee’s and the employer’s share), corporate income and excise. It divides by a broader income measure that adds the employer’s payroll contribution, employer-paid health premiums and social insurance benefits to market income. Refundable tax credits count as negative tax. Corporate tax is split 75 percent to owners of capital and 25 percent to workers.
Average federal tax rate, all four federal taxes, 2021
How to read it: each bar is the average rate of all four federal taxes (income, payroll, corporate and excise) for that fifth of households in 2021, from the lowest fifth (−22.9%) through the second (0.3%), middle (7.8%), fourth (13.9%) and highest (24.8%) to the top 1% (29.8%), with all households at 17.4%. CBO income groups, ranked by size-adjusted income before transfers and taxes. The lowest fifth’s rate is negative because refundable credits, including the 2021 recovery rebate and expanded child credit, exceeded the taxes it owed.
Source: CBO, The Distribution of Household Income in 2021, Table C-2.
With every federal tax counted, the top 1 percent paid 29.8 percent of its income in 2021 and the highest fifth 24.8 percent. The middle fifth paid 7.8 percent. The lowest fifth’s rate was minus 22.9 percent, meaning refundable credits exceeded every federal tax it paid, a pandemic-year figure; in 2019 that group’s rate was 0.6 percent and the top 1 percent’s was 30.0 percent. By CBO’s count, households in the highest fifth received about 59 percent of all income, including 95 percent of realized capital gains, and paid 84 percent of federal taxes. The top 1 percent alone received 21.1 percent of income and paid 36.0 percent of federal taxes.
Two of CBO’s choices decide how progressive this looks, and both are contested. Counting refundable credits as negative tax pushes the bottom rate below zero; leave the credits out, as the IRS tables do, and the bottom rate is a small positive number. Assigning three quarters of the corporate tax to capital owners raises the top 1 percent’s rate; economists who put more of the burden on workers would show a smaller gap. CBO notes that researchers disagree about the allocation and that the true incidence could differ from its assumption. It also says something the rest of this page depends on. Its income measure excludes unrealized capital gains, the same exclusion as the IRS.
The 400 richest, counting what they did not sell
In September 2021 two economists in the Biden White House, Greg Leiserson at the Council of Economic Advisers and Danny Yagan at the Office of Management and Budget, published an estimate that has anchored the other side of the argument since. They asked what the 400 wealthiest families, the Forbes 400, paid in federal individual income tax as a share of an income measure that included the growth in their wealth. Their answer for 2010 to 2018 was 8.2 percent.
The arithmetic is public. They estimated $149 billion of federal income tax paid by the 400 over the nine years, taking the IRS figure for the 400 highest-income returns and scaling it down by 0.63, because the highest-wealth families are not the highest-income ones. Warren Buffett was on the 2015 Forbes list with $11.6 million of reported income, which did not place him in the top 14,000 returns that year. For income they took the change in the Forbes 400’s combined wealth, $1.62 trillion, and added the taxes back, for $1.82 trillion. The ratio is 8.2 percent. Varying the scaling assumption moved it between 6 and 12 percent.
The authors listed what the figure leaves out. It is the individual income tax only; corporate, estate and foreign taxes are excluded. It omits consumption, which means the income denominator is too small and the 8.2 percent is, by their own account, higher than a fully comprehensive rate would be. And it rests on Forbes’s wealth estimates, which the authors say are surely measured with error. Yagan republished the work in the Oxford Review of Economic Policy in 2023 with the assumptions tightened and the years extended to 1992 through 2020. The baseline came out at 9.6 percent, or 12.0 percent after adjusting for inflation, with a range of 6.7 to 14.6 percent, and the original 2010 to 2018 window recomputed to 8.0 percent.
ProPublica went further in June 2021, using leaked IRS returns for the 25 richest Americans. It divided their federal income tax over 2014 to 2018, $13.6 billion, by the growth in their Forbes wealth, $401 billion, and called the result, 3.4 percent, their “true tax rate.” Buffett’s was 0.1 percent: $23.7 million of tax on $24.3 billion of wealth growth. Elon Musk’s was 3.27 percent; he paid $68,000 in federal income tax in 2015 and nothing in 2018. Michael Bloomberg’s was 1.3 percent, though on his 2018 reported income of $1.9 billion he paid $70.7 million, a 3.7 percent rate by the ordinary measure, after $968 million of charitable deductions. Carl Icahn paid no federal income tax in 2016 or 2017 on $544 million of adjusted gross income, because the interest on his loans exceeded it.
ProPublica’s denominator is wealth growth alone, with no taxes added back, so its figure is not the same measure as the CEA’s and is lower by construction. Yagan describes ProPublica’s method as nearly identical to his own except that it followed a fixed set of 25 people and used the leaked returns. The comparison ProPublica offered instead was with ordinary households: over the same five years, it calculated, a typical wage-earning household in its early forties paid about $160 in taxes for every $100 its wealth grew. Bezos paid $1.09.
The Buffett claim, as he made it
In the New York Times on 14 August 2011 Buffett wrote that his 2010 federal tax bill, income tax plus the payroll taxes paid by him and on his behalf, was $6,938,744, “only 17.4 percent of my taxable income,” and lower than the 33 to 41 percent paid by the other 20 people in his office. That comparison is on taxable income, the ordinary measure, and it is true of Buffett because almost all of his income is capital gains and dividends and almost none is wages. It is not true of the top 1 percent as a group, whose 26.3 percent rate is above the 14.1 percent average. In the same piece he cited the IRS series for the 400 highest-income returns: a 29.2 percent rate in 1992, 21.5 percent in 2008.
Where the argument lives
Put the IRS and the CEA side by side and the disagreement shrinks to three choices. Whether unrealized gains are income. Whether the corporate tax belongs to the shareholders whose stock it depresses. Whether refundable credits and transfers count on the other side of the ledger. Each choice moves the answer by more than any error in the data.
The strongest case that the richest pay too little
Income is what you can spend, and a billionaire whose stock rose $10 billion can spend against it, by borrowing, without ever selling. Tesla disclosed in 2021 that Musk had pledged about 92 million shares, then worth $57.7 billion, as collateral for personal loans; Oracle disclosed in 2014 that Larry Ellison had a credit line secured by about $10 billion of his shares. Loans are not income and are not taxed. If the borrower holds the stock until death, the gain is never taxed at all, because heirs inherit at market value under the step-up in basis. On this view the IRS measure is not conservative. It is blind to the main way the very richest get richer, and a 26 percent rate on the sliver of income they choose to realize says nothing about their real burden.
The strongest case that they pay their share
Nearly all of those unrealized gains are stock in companies, and the companies pay corporate income tax on the profits that drive the stock price every year. The Tax Foundation’s reply to the CEA, published the next day, was that an income measure which counts corporate profits as they accrue to shareholders must count the corporate tax on those profits too, and that the CEA counted the income and not the tax. Saez and Zucman’s own figure for the top 400 does count it. Their 2018 estimate of everything the 400 paid at every level of government came to 23 percent of income, which the Tax Foundation breaks down from their data as about 9 percent individual income tax, roughly 10 points of corporate tax, a point of estate tax and 2.3 points of sales tax. Yagan makes the same point in his 2023 paper: combine a 10 percent individual rate with the 21 percent statutory corporate rate, which he calls an upper bound on the effective rate, and the all-in federal income tax on corporate income is about 29 percent. On this view a 400-family rate of 8 percent describes one tax rather than the tax system, and the same families’ full burden comes out within a few points of what the top 1 percent pays.
Saez and Zucman then turn that 23 percent into the other side’s best line. Their estimate for what working and middle-class Americans paid in 2018, all taxes at all levels, was 25 to 30 percent, above the 400 richest, and they wrote that 2018 was the first year in which billionaires paid a lower rate than the working class. That conclusion depends on three further choices: assigning the corporate tax to shareholders, measuring taxes against pre-tax income with no credit for the transfers and refundable credits that flow back to lower earners, and counting the sales and payroll taxes that fall hardest on wages. The Tax Foundation also cites the economists Gerald Auten and David Splinter, who put the total average tax rate of the top 0.01 percent, a larger group than the top 400, at 37.4 percent in 2014. The gap between 23 and 37 percent for overlapping groups is the size of the definitional dispute.
One thing the data will not do is choose. Whether a gain that exists only on paper is income is a question about what income means, and the IRS, the CBO, the CEA and Saez and Zucman each answered it before they measured anything. This page treats each set of assumptions as a choice rather than a finding, and leaves the question where the sources leave it.
Why the two measures split at the top
The mechanism is the same in every source. Wages are taxed when paid, at rates that reach 37 percent. Gains on assets held more than a year are taxed at a top rate of 20 percent, plus a 3.8 percent surtax above an income threshold, and only when the asset is sold. The seller decides when that is. A founder who holds his company’s stock for thirty years pays no income tax on its rise for thirty years, and if he dies holding it the rise is never taxed, because the cost basis resets to market value for his heirs. The University of Southern California law professor Edward McCaffery gave the sequence its name, buy, borrow, die, and ProPublica’s documents showed it in operation.
The top 25 on ProPublica’s list reported $158 million in wages in 2018, 1.1 percent of their reported income. Everything else was dividends and sales of investments, taxed at the lower rates, when it was taxed at all. Buffett’s company pays no dividend, which is why a man worth about $110 billion in 2021 reported between $11.6 million and $25 million a year from 2015 to 2018. This is also why the IRS ladder bends at the top. The 1,531 richest returns pay a lower rate than the top 1 percent because more of what they report is capital income, and it is why any measure built on reported income will understate what the richest gain in a year in which their assets rise.
The same mechanism runs the other way in a bad year. In 2021 realized capital gains reached $2.1 trillion, the highest per household since CBO’s series began in 1979, and the top 1 percent’s share of federal income tax spiked to 45.8 percent because they sold. In a year when markets fall, the Forbes 400’s wealth can shrink, and a rate computed on wealth change turns negative or meaningless. Yagan reports the median over 435 start-and-end combinations for that reason. Any single year, in either direction, can be made to say almost anything.
State taxes, and how the United States compares
Federal taxes are the progressive part of the American system. State and local taxes run the other way. The Institute on Taxation and Economic Policy’s seventh edition of Who Pays?, published in January 2024 on 2023 incomes, finds the poorest fifth of households paying 11.4 percent of their income in state and local taxes, the middle fifth 10.5 percent and the top 1 percent 7.2 percent. In 41 states the top 1 percent pay a lower rate than any other group. Sales and excise taxes do most of it: 7 percent of income for the poorest fifth, 1 percent for the top 1 percent, because the rich save what the poor spend. Florida is the most regressive, with the poorest fifth paying almost five times the rate of the wealthiest, followed by Washington, Tennessee, Pennsylvania and Nevada. Six of the ten most regressive states have no broad income tax.
ITEP is an organization that favors progressive taxation, and its income measure and incidence assumptions are its own, but its finding that state systems are regressive is shared by the state agencies in Minnesota, Texas, Connecticut and Maine that run their own incidence studies, which the report cites. It does not overturn the federal picture. Add 7.2 points to the top 1 percent’s 29.8 and 11.4 to the bottom fifth’s, and the top still pays a far higher combined rate. It does narrow the gap in the middle, where a 10.5 percent state rate sits on top of a 7.8 percent federal one.
Abroad, the United States is a low-tax country with a top-heavy income tax. The OECD’s Revenue Statistics put total American tax revenue at 25.2 percent of GDP in 2023, against an OECD average of 33.9 percent, ranked 32nd of 38 members; the average rose to 34.1 percent in 2024. Most European systems collect more in total and rely more on payroll contributions and value-added taxes, which fall on everyone. The American system collects less overall and collects a larger share of it from the top. Both facts are used in this argument, usually by different people.
The trend
The top 1 percent’s share of federal income tax rose from 33.2 percent in 2001 to 38.4 percent in 2023, peaking at 45.8 percent in 2021. Their share of reported income rose over the same period from 17.4 to 20.6 percent. The bottom half’s share of the tax fell from 4.9 to 3.3 percent. The top 1 percent’s average rate, at 26.3 percent, was below its level before the 2017 tax law. The rising share of tax paid at the top therefore reflects a rising share of income at the top, taxed at a slightly lower rate.
The one long series for the very richest points down. Buffett quoted it in 2011: the 400 highest-income returns paid 29.2 percent of their reported income in federal tax in 1992 and 21.5 percent in 2008. The Tax Foundation, citing Saez and Zucman, puts the top 400’s individual income tax at about 11.4 percent of their broader income on average across 1950 to 2018, a figure the Tax Foundation describes as fairly stable over time.
The verdict: what the evidence shows
1. On income reported to the IRS, the richest pay the highest rates. Top 1 percent 26.3 percent, all taxpayers 14.1 percent, bottom half 3.7 percent, tax year 2023. The top 1 percent paid 38.4 percent of all federal income tax on 20.6 percent of the income.
2. Counting all four federal taxes, the pattern holds. CBO, 2021: top 1 percent 29.8 percent, highest fifth 24.8, middle fifth 7.8, lowest fifth negative. The top fifth paid 84 percent of federal taxes on 59 percent of income.
3. The rate dips at the very top. The top 0.001 percent paid 23.6 percent in 2023, below the top 1 percent, because their income is mostly capital gains and dividends taxed at 20 to 23.8 percent.
4. Count gains on unsold assets as income and the 400 wealthiest families paid about 8 percent in federal individual income tax over 2010 to 2018 (CEA), 9.6 to 12 percent over 1992 to 2020 (Yagan). Divide by wealth growth alone and the 25 richest paid 3.4 percent (ProPublica). None of these counts the corporate tax on the same profits.
5. Add every tax at every level of government and Saez and Zucman put the 400 richest at 23 percent in 2018, against 25 to 30 percent for working and middle-class households. Auten and Splinter put the top 0.01 percent at 37.4 percent in 2014 on different definitions. The distance between those two figures is the whole disagreement.
6. State and local taxes are regressive everywhere except six states and Washington, DC. They narrow the federal gap in the middle of the distribution and do not close it at the top.
Common claims, measured
Claim“The top 1 percent pay 40 percent of federal income taxes.”
EvidenceClose. 38.4 percent in 2023, 40.4 percent in 2022, 45.8 percent in 2021. Federal individual income tax only, which is about half of federal revenue; their share of all federal taxes was 36.0 percent in 2021 (CBO).
Claim“Billionaires pay a lower tax rate than their secretaries.”
EvidenceTrue for some individuals on reported income, as Buffett showed of himself in 2011 (17.4 percent against 33 to 41 percent in his office), and true for the 400 richest as a group only if unsold gains count as income (8.2 percent, CEA) or if all taxes at all levels are counted against pre-tax income (23 percent against 25 to 30, Saez and Zucman). False for the top 1 percent on any measure of income received.
Claim“The 25 richest Americans paid a 3.4 percent tax rate.”
EvidenceThat is ProPublica’s figure and its arithmetic is right, but the denominator is growth in wealth, not income. On the same people’s reported income, the rate would be far higher. The two numbers answer different questions.
Download the conclusion
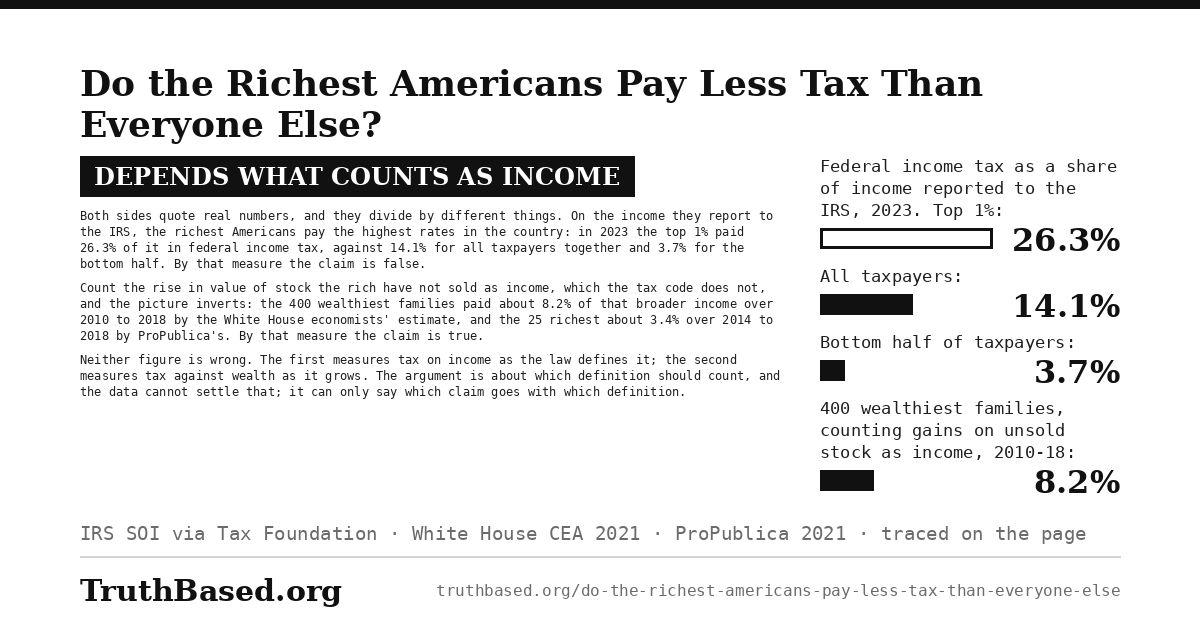
This card shows the three rates the argument turns on, drawn to scale: what the top 1 percent paid on the income they reported, what everyone paid on the same measure, and what the 400 richest paid once gains on unsold assets were counted. It is 1,200 by 630 pixels, the size social networks use for link previews, and anyone may download it and post it.
What would change this conclusion?
This article concludes that the richest Americans pay the highest rates on income they receive and low rates on a measure that includes unrealized gains, and that the data cannot choose between the measures. That would change if:
1. The IRS published effective rates for the top 0.001 percent that fell below the all-taxpayer average of about 14 percent on adjusted gross income. In 2023 the figure was 23.6 percent.
2. A study with administrative data on the wealth and taxes of the 400 richest, rather than Forbes estimates and a scaling factor, found their individual income tax rate on income including unrealized gains to be near or above 20 percent. Yagan’s range is 6.7 to 14.6 percent.
3. A published estimate that counted corporate, estate, payroll and sales taxes for the 400 richest, on the same income definition, produced a total rate clearly below the working-class rate under every reasonable treatment of transfers and corporate tax. Saez and Zucman find it on their definitions; Auten and Splinter’s 37.4 percent for the top 0.01 percent shows how far another set of definitions moves the answer.
Sources
Internal Revenue Service, Statistics of Income. Individual statistical tables by tax rate and income percentile, tax year 2023: Table 4.1 (2001 to 2023) and Table 4.3 (expanded top percentiles). Spreadsheets. irs.gov. Read for this page through the Tax Foundation’s compilation of the same table: Erica York and Emily Kraschel, “Summary of the Latest Federal Income Tax Data, Tax Year 2023,” 15 April 2026. taxfoundation.org
Congressional Budget Office (2024). The Distribution of Household Income in 2021. 11 September 2024. Tables C-1 to C-3 and Appendix A on incidence. cbo.gov/publication/60341
U.S. Treasury. Receipts by source, fiscal years 2023 and 2024: individual income taxes $2,176.5 billion and $2,426.1 billion; total receipts $4,439 billion and $4,919 billion. Treasury Table 2, Receipts by Source, 2024, and the Bureau of the Fiscal Service budget summary for September 2024.
Leiserson, G. and Yagan, D. (2021). “What Is the Average Federal Individual Income Tax Rate on the Wealthiest Americans?” White House Council of Economic Advisers, 23 September 2021. bidenwhitehouse.archives.gov
Yagan, D. (2023). “What Is the Average Federal Individual Income Tax Rate on the Wealthiest Americans?” Oxford Review of Economic Policy, April 2023. Author’s version. eml.berkeley.edu
Eisinger, J., Ernsthausen, J. and Kiel, P. (2021). “The Secret IRS Files: Trove of Never-Before-Seen Records Reveal How the Wealthiest Avoid Income Tax.” ProPublica, 8 June 2021. propublica.org
Saez, E. and Zucman, G. (2019). The Triumph of Injustice. W.W. Norton. Figures here from the authors’ presentation slides. eml.berkeley.edu
York, E., Watson, G. and McBride, W. (2021). “Latest White House Report Tells Incomplete Story on Average Tax Rates for Wealthy.” Tax Foundation, 24 September 2021. Source for the corporate-tax objection and for the Saez-Zucman breakdown and Auten-Splinter figure cited in the text. taxfoundation.org
Buffett, W. E. (2011). “Stop Coddling the Super-Rich.” The New York Times, 14 August 2011. nytimes.com
Institute on Taxation and Economic Policy (2024). Who Pays? A Distributional Analysis of the Tax Systems in All 50 States, 7th edition, January 2024. itep.org
OECD. Revenue Statistics 2024, United States country note (2023 data), and Revenue Statistics 2025 (2024 OECD average). oecd.org
Note on the sourcing. The IRS percentile tables are spreadsheets, and the cells here are as given in the Tax Foundation compilation, which cites the same table and carries the IRS definitions. Two figures often quoted from these sources are absent because they could not be confirmed in them: Saez and Zucman’s 24.2 percent for the bottom half, for which their slides give a range of 25 to 30 percent, and the OECD’s 2024 figure for the United States. The Auten and Splinter figure is cited as the Tax Foundation reports it.
Cite this article
TruthBased.org. "Do the Richest Americans Pay Less Tax Than Everyone Else?" September 2026. https://www.truthbased.org/do-the-richest-americans-pay-less-tax-than-everyone-else