Economics
Job Creation Claims: Presidents vs. The Data
Every administration's jobs record against BLS primary-source data.
International Comparisons
Most Educated Countries in the World
47 countries ranked by tertiary attainment, and why more ≠ better.
Economics
Is College Still Worth the Cost?
Wage premiums, debt loads, and ROI by major and institution.
The Gender Wage Gap: What the Data Actually Shows
Women earn less than men on average. That much is not in dispute. What is disputed is why, and whether the gap reflects discrimination, occupational choice, hours worked, or all three. The data is more complicated than either “77 cents” or “it’s fully explained” suggests.
Jump to the verdict ↓
The short answer
Yes, and most of it is not what people argue about. The raw gap is real, more than half of it is accounted for by measured differences such as occupation and industry, and a residue of about 8 percent survives the fullest set of controls. The dominant driver over a career is what happens after children, not unequal pay for the same job.
The Raw (Unadjusted) Gap
The most-cited figure (“women earn 77 cents on the dollar”) comes from comparing the median annual earnings of all men and all women who work full time, year round, regardless of occupation, industry, experience, or how many hours beyond full time they work. This is a real gap, but it’s a measure of aggregate earnings differences, not a measure of pay discrimination within identical jobs.
Unadjusted Gender Wage Gap — Official U.S. Figures
2024–2025
BLS: Full-time workers (weekly median)82.1% (gap: 17.9%)
Women’s median weekly earnings$1,089/week
Men’s median weekly earnings$1,326/week
Census ASEC: Full-time, year-round (annual)80.9% (gap: 19.1%)
Women’s median annual earnings$57,520
Men’s median annual earnings$71,090
All workers with earnings, incl. part-time and part-year (Census data, as computed by IWPR)75.6% (gap: 24.4%)
Median hourly earnings, full- and part-time workers (Pew, 2024)85% (gap: 15%)
The “77 cents” figure was the Census Bureau’s ratio for full-time, year-round workers around 2010 to 2012. It left part-time workers out. The same measure now stands at 80.9 cents, down from 82.7 in 2023, its second annual fall in a row, and the weekly measure for full-time workers is 82.1 cents. None of these is wrong as a description of aggregate earnings. All are misleading if used to describe pay discrimination within comparable jobs.
Why the raw gap is not the same as pay discriminationThe raw gap combines several factors: differences in occupation and industry, differences in average hours worked, differences in years of work experience and seniority, and differences in employer size and sector. None of these differences are neutral in terms of cause (they themselves may reflect structural inequalities) but conflating them with “same job, different pay” misrepresents what the data shows.
The appropriate question is: how much of the gap remains after controlling for these factors? That is the adjusted gap.
Download this conclusion: four measures of one gap
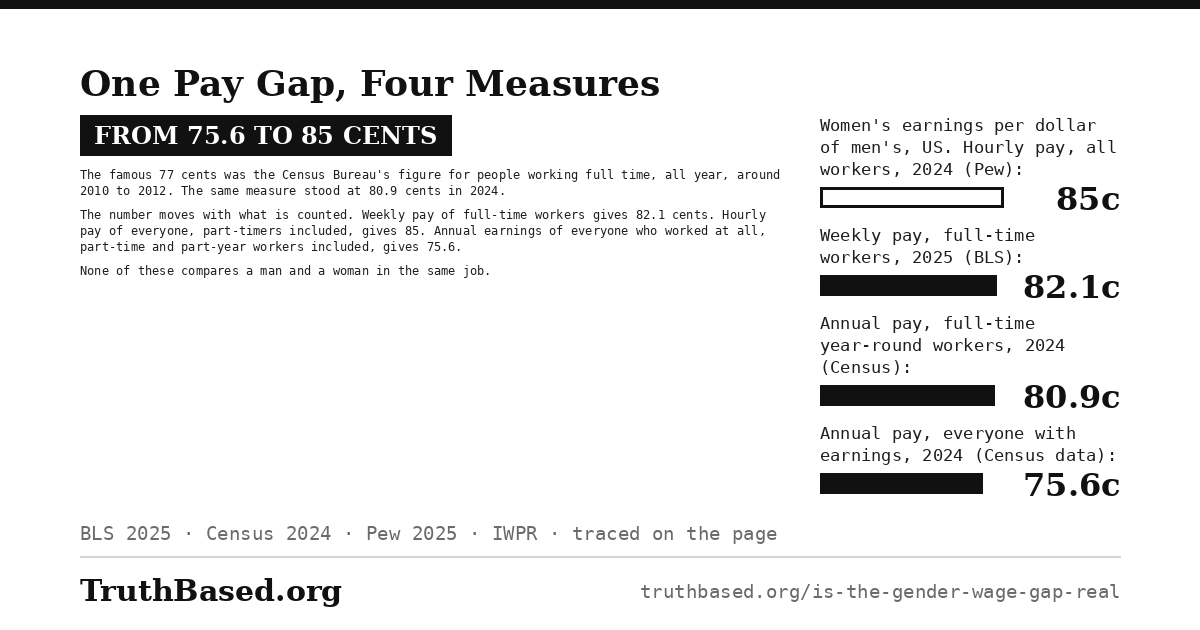
This section as one image: where the 77 cents came from, and the four current figures, from 75.6 to 85 cents, with what each one counts.
The Adjusted Gap
Economists decompose the wage gap into the portion explained by measurable worker characteristics (occupation, education, hours, experience, industry, firm size) and an unexplained residual. The unexplained portion is often called the “adjusted gap.” It captures a mix of potential discrimination and unmeasured factors.
Adjusted Gender Wage Gap — Key Studies
Various years, controlled analyses
Unadjusted gap, full-time workers aged 25 to 64, 2010 (Blau & Kahn 2017)20.7%
With education and experience controlled (same study)17.9%
With occupation, industry and union status added (same study)8.4% residual gap
Same job title, employer and location, in salaries reported to Glassdoor (2016)5.4% residual
Share of the 2010 gap explained by those measured factorsAbout 59% (20.7% down to 8.4%)
Unexplained portion (potential discrimination + unmeasured)About 41% of the raw gap
Claudia Goldin, who won the 2023 Nobel Prize in economics for her work on women in the labor market, argues that the largest single driver of the gender wage gap is not direct discrimination but the “greedy jobs” premium: the disproportionate compensation for long, inflexible hours in certain high-earning professions (law, finance, consulting). Because women disproportionately reduce hours or switch to more flexible arrangements around childbirth, they lose access to this premium at higher rates than men.
What “unexplained” meansThe unexplained residual gap does not equal discrimination. It represents: (1) unmeasured worker characteristics (commute willingness, specific skills, performance, negotiation); (2) unmeasured job characteristics (risk, physical demands); (3) actual discrimination in pay-setting; and (4) statistical noise. Separating these components requires methods beyond standard decomposition, primarily audit studies and natural experiments.
Occupation Sorting
About 50% of the raw wage gap is attributable to women and men working in different occupations and industries, a phenomenon called occupational sorting. Women are overrepresented in education, healthcare support, administrative services, and social work; men are overrepresented in engineering, construction, securities sales and financial advising, and technology.
| Occupation | Median weekly earnings | % women | Women’s pay as % of men’s |
|---|---|---|---|
| Software developers | $2,506 | 20.5% | 94.5% |
| Financial managers | $1,877 | 54.0% | 82.3% |
| Registered nurses | $1,563 | 86.1% | 79.8% |
| Elementary and middle school teachers | $1,275 | 78.6% | 90.8% |
| Social workers (the survey’s “all other” category, its largest) | $1,298 | 83.6% | 81.7% |
| Civil engineers | $1,999 | 18.5% | 81.5% |
| Home health aides | $752 | 88.7% | Not published: too few men |
| Physicians (excluding surgeons, radiologists and emergency physicians) | $3,100 | 42.8% | 93.0% |
Sorting is not the whole of it. In every occupation in the table where the survey publishes both figures, women’s median pay is below men’s, from 79.8% of it among registered nurses to 94.5% among software developers.
Does occupation choice fully explain the gap?The key structural finding, from Levanon, England and Allison’s study of census data from 1950 to 2000, is the “devaluation” pattern: when women enter a field in large numbers, wages in that field tend to decline relative to other fields. Computer programming ran the other way: pay and prestige rose as men took over a job in which women had been 30 to 50 percent of the workforce in the 1950s. This means “choice of occupation” and “labor market discrimination” are not cleanly separable. The value placed on occupations is partly endogenous to gender composition.
Paula England and others have documented this systematically: female-dominated occupations pay less than male-dominated occupations with similar skill requirements, educational demands, and working conditions. This gap is not fully explained by the characteristics of the work itself.
How to read it: each bar is how much less women earned than men in 2010, among full-time workers aged 25 to 64, as more of the differences between them are taken into account. Unadjusted 20.7%, with education and experience controlled 17.9%, with occupation, industry and union status added 8.4%. Source: Blau and Kahn, Journal of Economic Literature, 2017, using the Panel Study of Income Dynamics.
The Motherhood Penalty
The most well-documented driver of the gender wage gap is not raw discrimination but the motherhood penalty: the earnings loss women experience following childbirth, relative to similarly qualified men who have children.
Motherhood Penalty — Key Findings
Long-run earnings trajectory studies
Earnings penalty 10 years post-birth (Danish admin data, Kleven et al.)About −20% relative to men, in the long run
What the penalty is made of (same study)Labor force participation, hours worked and wage rates, in roughly equal parts
Fatherhood “premium” in U.S. longitudinal data (Budig 2014)More than +6% for fathers; −4% per child for mothers
U.S. gender earnings gap explained by child penaltyMost of it (Kleven); two-thirds or more (Cortés & Pan)
Share of gap explained by child penalty (Denmark, 2013)80% of total gender gap
Long-run penalty in six countries (Kleven and co-authors, 2019)Denmark and Sweden 21–26%; United Kingdom and United States 31–44%; Germany and Austria 51–61%
The motherhood penalty is driven by several mechanisms: (1) career interruptions and reduced experience accumulation; (2) reduction in hours worked; (3) switching to lower-paying but more flexible employers or roles; and (4) possible employer discrimination against mothers (the “maternal wall”).
The relative contributions of these mechanisms vary by study. Claudia Goldin’s work emphasizes the role of temporal flexibility: in professions that pay a very high premium for being available at specific times (law, finance, consulting), reducing hours by even 20% reduces pay by far more than 20%. Women who shift to flexible arrangements post-childbirth exit the “greedy job” pay structure entirely.
Audit studies find some direct employer discrimination against mothers: equally qualified résumés that signal parenthood drew fewer callbacks for women and about the same number for men (Correll et al., 2007, American Journal of Sociology). This “maternal wall” effect is separate from the hours/flexibility channel.
Discrimination: Audit Studies
The most rigorous direct evidence on gender discrimination in hiring and pay comes from audit studies (randomized resume experiments) and natural experiments. These bypass the self-selection problems in observational data.
| Study | Method | Finding |
|---|---|---|
| Goldin & Rouse (2000, AER) | Blind auditions in orchestras | Blind auditions explain about a third of the rise in women among new hires and about 25% of the rise in women’s share of players; the authors note that several estimates have large standard errors |
| Moss-Racusin et al. (2012, PNAS) | Identical STEM résumés (male/female names) | Female-named applicants rated less competent; offered lower starting salaries |
| Correll, Benard & Paik (2007, AJS) | Résumés with parenthood signal | Mothers rated less competent, offered lower starting salaries and called back less often; fathers were not penalized, and in the laboratory part sometimes gained |
| Kricheli-Katz & Regev (2016) | eBay identical items, seller gender | Women selling identical new items received about 80 cents for each dollar men received; for used items, 97 cents |
| Neumark, Bank & Van Nort (1996, QJE) | Matched pairs at restaurants | In high-price restaurants, where earnings are higher, women were about 40 percentage points less likely to get a job offer |
| Riach & Rich (2002, EJ) review | Field experiments from 1966 to 2000 in ten countries | “Significant, persistent and pervasive” discrimination against non-whites and women in labour, housing and product markets |
Audit studies find discrimination is real, and it varies by setting. A 2014 survey of sixty-seven later experiments found it against women in some jobs and against men applying to female-dominated ones. A 2025 meta-analysis of 37 American audit studies, covering 243,202 fictitious job applications, found no statistically significant gender discrimination in hiring overall, with the direction of bias depending on whether an occupation is mostly male or mostly female. Studies specifically designed to measure discrimination in pay (rather than hiring) are fewer and harder to conduct. The conclusion from this literature is that discrimination is one component of the wage gap, not the sole explanation, but not zero.
International Comparisons
The gender wage gap is a global phenomenon but varies substantially across countries, suggesting policy and institutional factors matter.
| Country | Gender Wage Gap (%) | Notes |
|---|---|---|
| South Korea | 31.2% | Highest in OECD |
| Japan | 21.3% | — |
| United States | 17.0% | OECD definition; above the OECD average |
| OECD average | About 12% | The OECD’s own summary figure |
| Germany | 13.7% | 2021 figure |
| United Kingdom | 14.5% | Up from 14.2% in 2021 |
| Canada | 17.1% | — |
| Sweden | 7.3% | As reported in PwC’s Women in Work index |
| Denmark | 5.8% | Ninth lowest in the OECD |
| Belgium | 1.1% | Among the lowest in the OECD |
| Luxembourg | 0.4% | Lowest in the OECD; 2020 figure |
Child penalties, the largest single driver, differ sharply between countries: 21 to 26% in Denmark and Sweden, 31 to 44% in the United Kingdom and the United States, and 51 to 61% in Germany and Austria. The researchers who measured them name family policy, meaning parental leave and childcare, and gender norms as the candidate explanations, without settling between them. Even Sweden, with generous family policy, keeps a 7.3% gap.
How to read it: each bar is how much less the median woman working full time earned than the median man, as a share of his earnings. South Korea 31.2%, Japan 21.3%, Canada 17.1%, United States 17.0%, United Kingdom 14.5%, Germany 13.7%, the OECD average about 12%, Sweden 7.3%, Denmark 5.8%, Belgium 1.1%, Luxembourg 0.4%. Figures are for 2022 where the OECD had them; Germany’s is for 2021 and Luxembourg’s for 2020, and Sweden’s is the figure PwC’s Women in Work index reports from OECD data. Source: OECD gender wage gap indicator.
Steelmanning Both Sides
The motherhood penalty of ~20% over 10 years is documented in high-quality administrative data across multiple countries. It is not primarily explained by women freely choosing less demanding work. It is driven by the structure of high-paying jobs that penalize flexibility disproportionately. Women who take the same leave as men in countries with gender-neutral parental leave systems still experience larger career interruptions because of unequal uptake.
Occupational devaluation is real: wages in female-dominated fields are systematically lower than male-dominated fields with comparable skill demands, and this pattern emerged historically as women entered fields (computing, biology). The “choice of occupation” argument therefore doesn’t fully explain the gap. The market doesn’t value female-coded work equally. Audit studies confirm direct discrimination in specific high-value hiring contexts (STEM, high-status service industries). The residual adjusted gap of about 8% is real and partially reflects employer behavior.
The strongest case that the gap is largely explained by non-discriminatory factorsAfter controlling for education, experience, occupation, industry, and union status, about 59% of the gap is explained by measurable differences. Women aged 25 to 34 earned 95 cents for each dollar men their age earned in 2024, and in Budig’s data childless, unmarried women earned 96 cents. The gap is primarily a phenomenon that emerges with childbearing, not a uniform experience across the female workforce.
The “greedy jobs” premium is not discrimination per se. It is a market valuing specific time patterns. The solution is changing the structure of high-paying work (reducing the premium for continuous availability) rather than attributing earnings differences entirely to bias. Countries with equal pay laws and high female labor force participation still have significant gaps because of occupational sorting, suggesting legislation alone does not resolve the structural issue.
Men take more dangerous jobs (91.5% of workers killed on the job in 2023 were men), work longer hours on average, and are more concentrated in high-variance/high-risk career paths. These factors are compensated by higher average wages and are not captured in simple comparisons.
Where the evidence convergesBoth sides of this debate share common ground on several empirical points: the raw gap is real; a significant portion is explained by occupational and hours differences; a residual of about 8% persists after the fullest controls; the motherhood penalty is the dominant long-run driver; and discrimination exists in some contexts but is not uniform. The main dispute is over interpretation. Whether the occupational structure itself reflects discrimination (devaluation thesis) or free preferences operating in a neutral market (compensating differentials thesis). Both have empirical support.
The verdict: what the evidence shows
Claims and evidence
Claim“Women earn 77 cents for every man’s dollar”
EvidenceOutdated. It was the Census Bureau’s figure for full-time, year-round workers around 2010 to 2012. The same measure is now 80.9 cents (2024), and the BLS weekly figure for full-time workers is 82.1 cents (2025). Neither controls for occupation, hours, experience, or industry. The adjusted gap is about 8%.
Claim“The wage gap is entirely explained by women’s choices”
EvidenceNot accurate. After controlling for education, experience, occupation, industry, and union status, a residual gap of about 8% remains. Audit studies find discrimination in some sectors. The “choice” explanation doesn’t account for why female-dominated occupations pay less as a structural matter.
Claim“Women who make the same choices earn the same”
EvidencePartially true for some groups. Women aged 25 to 34 earn 95 cents on the dollar, and childless, unmarried women 96 cents. But a motherhood penalty of ~20% emerges over 10 years after childbirth. A fatherhood premium exists simultaneously.
Claim“The pay gap is just discrimination”
EvidenceDiscrimination exists in some contexts but isn’t the sole explanation. The adjusted residual gap is partly unexplained discrimination and partly unmeasured factors. Audit studies find discrimination that varies by occupation and setting.
Download the conclusion
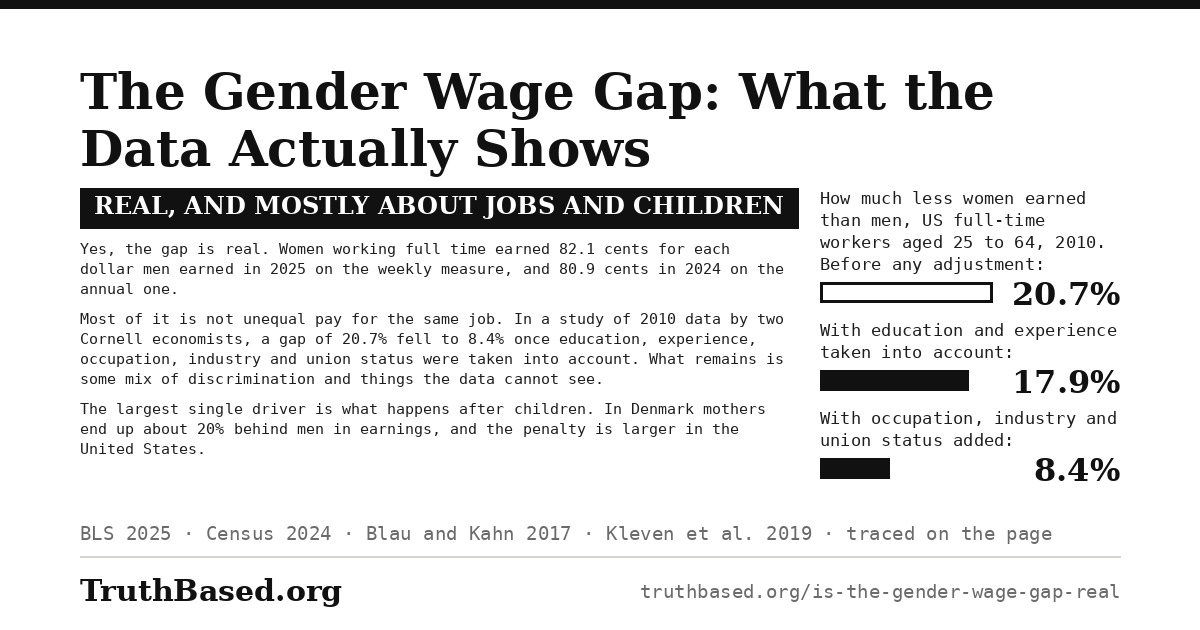
This card gives the answer, that the gap is real and that most of it is not unequal pay for the same job, the three figures showing how it shrinks as the differences between workers are taken into account, and the part children play. It is 1,200 by 630 pixels, the size social networks use for link previews, and anyone may download it and post it.
What would change this conclusion
This article concludes that: (1) the unadjusted gap is ~18% (full-time); (2) after the fullest controls, a residual of about 8% remains; (3) the motherhood penalty is the largest single driver; (4) discrimination exists in specific contexts; (5) occupational devaluation is real.
These conclusions would be falsified by:
1. Controlled studies consistently finding zero residual gap after complete accounting for measurable factors
2. Longitudinal data showing the motherhood penalty has disappeared as childcare access expanded
3. Replication failures of the major audit studies (Goldin & Rouse, Moss-Racusin, Correll)
4. Evidence that occupational wage differences between female-dominated and male-dominated fields are fully explained by non-gender skill and risk differences
You May Also Like
TruthBased.org is reader-supported. You can contribute by card or PayPal, or with cryptocurrency, on the support page.
Sources
U.S. Bureau of Labor Statistics. Usual Weekly Earnings of Wage and Salary Workers, 2025 annual data. Source for the headline figure: median weekly earnings of $1,089 for women and $1,326 for men, a ratio of 82.1%. BLS notes the 2025 annual estimates are 11-month averages because the federal government shutdown affected October CPS collection. bls.gov
Blau & Kahn. The Gender Wage Gap: Extent, Trends, and Explanations. Journal of Economic Literature, 2017. Source for the adjusted residual gap after controls for occupation, education, experience, and hours. aeaweb.org
Kleven, Landais & Søgaard. Children and Gender Inequality: Evidence from Denmark. American Economic Journal: Applied Economics, 2019. Source for the long-run child penalty of around 20% and for the finding that child penalties rose from about 40% of Danish gender inequality in 1980 to about 80% in 2013. henrikkleven.com
Kleven. The Geography of Child Penalties and Gender Norms, NBER Working Paper 30176. Source for the U.S. child penalty of 31% in earnings and the finding that child penalties account for most of the observed gender inequality in U.S. labor market outcomes. nber.org
Cortés & Pan. Children and the Remaining Gender Gaps in the Labor Market, NBER Working Paper 27980. Source for the U.S. estimate that close to two-thirds of the overall gender earnings gap is accounted for by the differential impact of children. The version published in the Journal of Economic Literature in 2023 puts it at more than two-thirds. nber.org
Goldin & Rouse. Orchestrating Impartiality: The Impact of "Blind" Auditions on Female Musicians. American Economic Review, 2000. Source for the blind-audition finding. aeaweb.org
Correll, Benard & Paik. Getting a Job: Is There a Motherhood Penalty? American Journal of Sociology, 2007. Source for the finding that equally qualified résumés with parenthood signals produce lower callback rates for mothers and not for fathers. journals.uchicago.edu
U.S. Bureau of Labor Statistics. Current Population Survey, table 39: median weekly earnings of full-time wage and salary workers by detailed occupation and sex, 2025 annual averages. Source for the occupation table; the shares of women and the pay ratios are computed from its counts and medians. bls.gov
Chamberlain. Demystifying the Gender Pay Gap: Evidence from Glassdoor Salary Data. Glassdoor, March 2016. Source for the 5.4% gap among workers with the same job title, employer and location, from more than 505,000 self-reported salaries. glassdoor.com
Moss-Racusin, Dovidio, Brescoll, Graham & Handelsman. Science faculty’s subtle gender biases favor male students. Proceedings of the National Academy of Sciences, 2012. Source for the laboratory-manager application experiment. doi.org
Institute for Women’s Policy Research. Gender Wage Gap Worsens for Second Year in a Row: annual gender wage gap by race and ethnicity in 2024. Source for the all-workers ratio of 75.6%, computed from the Census Bureau’s Current Population Survey. iwpr.org
Goldin. A Grand Gender Convergence: Its Last Chapter. American Economic Review, 2014. Source for the argument that the gap would be considerably reduced if firms did not disproportionately reward long and particular hours. doi.org
Levanon, England & Allison. Occupational Feminization and Pay: Assessing Causal Dynamics Using 1950–2000 U.S. Census Data. Social Forces, 2009. Source for the devaluation finding. The figure for women among 1950s programmers is from The Atlantic’s account of the profession’s history, which draws on the historian Nathan Ensmenger. doi.org
Budig. The Fatherhood Bonus and the Motherhood Penalty: Parenthood and the Gender Gap in Pay. Third Way, 2014. Source for fathers’ earnings rising more than 6%, mothers’ falling 4% per child, and childless, unmarried women earning 96 cents on the dollar; the figures are as the New York Times reported them from the study. thirdway.org
Riach & Rich. Field Experiments of Discrimination in the Market Place. Economic Journal, 2002; and Rich, IZA Discussion Paper 8584 (2014), a survey of sixty-seven field experiments conducted since 2000. Sources for the review row and for the finding that discrimination varies by setting. docs.iza.org
Kleven, Landais, Posch, Steinhauer & Zweimüller. Child Penalties across Countries: Evidence and Explanations. AEA Papers and Proceedings, 2019. Source for the long-run child penalties in six countries. doi.org
Park & Oh. Getting a Foot in the Door: A Meta-Analysis of U.S. Audit Studies of Gender Bias in Hiring. Sociological Science, 2025. Source for the finding of no significant overall gender discrimination across 37 audit studies, and for its variation with the gender make-up of the occupation. sociologicalscience.com
Neumark, Bank & Van Nort. Sex Discrimination in Restaurant Hiring: An Audit Study. Quarterly Journal of Economics, 1996. Source for the restaurant audit.
U.S. Census Bureau. Income in the United States: 2024 (P60-286). Source for the full-time, year-round female-to-male earnings ratio of 80.9% in 2024, down from 82.7% in 2023, and for median earnings of $71,090 and $57,520. census.gov
Pew Research Center. Gender pay gap in U.S. has narrowed slightly over 2 decades (4 March 2025). Source for the 85% ratio in median hourly earnings of full- and part-time workers in 2024. pewresearch.org
Kricheli-Katz & Regev. How Many Cents on the Dollar? Women and Men in Product Markets. Science Advances, 2016. Source for the eBay finding: about 80 cents on the dollar for identical new items and 97 cents for used ones.
U.S. Bureau of Labor Statistics. National Census of Fatal Occupational Injuries in 2023. Source for women being 8.5% (447 of 5,283) of workers killed on the job in 2023. bls.gov
OECD. Gender wage gap (indicator). Source for the international comparison figures, which are for 2022 where the OECD had them and are read here from published reproductions of its series (the Japan Institute for Labour Policy and Training’s 2024 databook and press reports of the 2022 release). Germany’s figure is for 2021, Luxembourg’s for 2020, and Sweden’s comes through PwC’s Women in Work index. data.oecd.org
Cite this article
TruthBased.org. “The Gender Wage Gap: What the Data Actually Shows” Updated September 2026. https://www.truthbased.org/is-the-gender-wage-gap-real