Crime & Justice
Did Police Funding Cuts Cause the 2020 Crime Surge?
Firearm homicide rose 46% by 2021, police budgets were mostly not cut, and what the four-city study found.
Crime & Justice
Which Side Commits More Political Violence?
Deaths and attacks by side in the counts of CSIS, Cato, New America and ADL, and what moves the totals.
Groups & Crime
Do Immigrants Commit More Crime?
No: 674 undocumented and 303 legal immigrants incarcerated per 100,000 against 1,195 native-born in Cato’s estimates from the 2024 American Community Survey, Texas arrest rates say the same, and why Europe differs.
Does the Death Penalty Deter Crime?
No study has shown that executions prevent murders, and the estimate that each prevents 18 did not survive a re-run of its own data. The deterrence research, then what capital cases cost, the part race plays and exonerations from death row.
Jump to the verdict ↓
What this covers
Whether the death penalty is just is a moral question this page does not try to settle. It covers what can be measured.
The short answer
No one has shown that it does. In 2012 the National Research Council found the research “not informative” about whether the death penalty decreases, increases or has no effect on homicide. Re-run with small changes, the studies that claimed large deterrent effects gave very different answers, some of them more murders rather than fewer.
A death sentence is not an execution
Many people sentenced to death are never executed. In 2023, five states carried out 24 executions, according to the Bureau of Justice Statistics (BJS), while 64 people left death row another way, 34 because a court overturned the conviction or the death sentence and 30 because they died of other causes.
Whether the death penalty deters murder, and what it costs, both come down to what it adds over the punishment the same murderer would otherwise get. In all 27 states that the Death Penalty Information Center (DPIC) counts as having the death penalty, the alternative sentence can be life without parole. The most common capital offense is first-degree murder with at least one aggravating factor that the law lists, such as a murder committed during a kidnapping or an armed robbery.
Death row and executions
BJS, 2023
People under sentence of death, end of 20232,192
States holding them26 + federal
States with a death penalty statute29 + federal
Executions in 202324
Admitted to prison under a death sentence in 202315
Executions, 1977–20231,582
Average time from the latest death sentence to execution, 2023279 months (about 23 years)
Source: Bureau of Justice Statistics, Capital Punishment, 2023 – Statistical Tables (2025). Four states with a statute (Delaware, New York, Oregon and Wyoming) held no one under sentence of death, and New Hampshire, which repealed its statute in 2019, still held one man sentenced before the repeal. DPIC counts 27 states with the death penalty, because it lists Delaware and New York, whose top courts struck down part of their death penalty statutes, among the states without it.
The evidence on deterrence
In 1975 the economist Isaac Ehrlich, using national figures for 1933 to 1969, estimated that each additional execution a year may have meant 7 or 8 fewer murders on average. In 1978 a National Research Council panel found his results sensitive to minor changes in the model and unstable over time, and concluded that the studies then available gave “no useful evidence” on whether the death penalty deters.
In 2003 Hashem Dezhbakhsh, Paul Rubin and Joanna Shepherd, using data for 3,054 U.S. counties from 1977 to 1996, reported that each execution meant 18 fewer murders on average, give or take 10. In 2005 Richard Berk, a UCLA statistician, found that several such claims rested on the few state-years with more than five executions, about 1% of the data.
Shepherd later split the same data by state. Of the 27 states that carried out executions in those years, she found that executions deterred murder in 6, made no difference in 8 and increased murders in 13, which she called brutalization. Where executions did not deter, she wrote, they “kill convicts uselessly” if deterrence is their purpose.
The re-analyses and the 2012 reviewIn 2005 the law professor John Donohue and the economist Justin Wolfers re-ran the recent studies claiming deterrence. The county study relied on four state figures to tell cause from effect: police payrolls, court spending, prison admissions and the Republican share of the presidential vote. Using its authors’ own data and code, they found that entering the vote share as one figure, as the paper describes, instead of the six its code used, turned 18 lives saved per execution into 18 lost. Across the study’s six versions of its model, using only the vote shares gave as many as 429 lives saved, and using only the other three figures as many as 86 lost. Once the margin of error around the published 18 allowed for counties in the same state moving together, it ran from each execution causing 82 more murders to each saving 119 lives. Executions are so rare, they concluded, that their effect on murder cannot be reliably told apart from the large swings in murder from year to year.
In 2012 a National Research Council committee chaired by Daniel Nagin concluded that “research to date on the effect of capital punishment on homicide is not informative about whether capital punishment decreases, increases, or has no effect on homicide rates.” It found that none of the studies accounted for the punishment a murderer would otherwise get, usually a long prison term or life without parole, and that all of them relied on unproven assumptions, including about how potential murderers judge their risk of execution. A lack of evidence, it stressed, is not evidence for or against deterrence.
In 2021 Brett Parker compared seven states that had recently abolished the death penalty with blends of the 29 that kept it, and found no evidence that a death penalty law deters murder, even the murder of strangers.
Lives saved per execution, 2003 county study re-run five ways
How to read it: each bar is how many lives one execution saved, net, in the version of the county study that gave its 18, as Donohue and Wolfers re-ran it with the authors’ data and code; below zero means more deaths. Source: Donohue and Wolfers (2005).
| How the model was run | Net lives saved per execution |
|---|---|
| As published | 18.5 |
| Vote share as one figure, as the paper describes | −17.7 |
| Without Texas | −41.6 |
| Only the police, court and prison figures | −52.3 |
| Only the vote shares | 288.8 |
The National Institute of Justice, drawing on Daniel Nagin’s 2013 review of the research, says the chance of being caught deters far more than even draconian punishment. Executions themselves are rare. In 2024 there were 25, while the Centers for Disease Control and Prevention counted 20,162 homicide deaths; by DPIC’s count, executions nearly doubled in 2025.
Capital cases cost more
Six state studies compared capital murder cases with similar cases where death was not sought, or with a system without the death penalty, and each found the capital cases cost more on average. They measure different things, and each row says what it compares.
What the death penalty added, six state studies
Published 2003–2015
Maryland (Urban Institute, 2008): death sentence, against death not sought+$1.9M
Nevada (Legislative Auditor, 2014): death sentence not carried out, against death not sought+$532K
Washington (Collins et al., 2015): death sought, against not sought+$1.06M
Kansas (Legislative Post Audit, 2003): median trial cost, death sentence against death not sought$500K+ vs. $33K
North Carolina (Cook, 2009): the whole state, each year, 2005–06almost +$11M
California (Alarcón & Mitchell, 2011): each year, against life without parole+$184M
California: in all, 1978 to 2011, for 13 executionsabout $4 billion
The difference starts before the trial. Once prosecutors seek death, jurors are questioned about their views on it (Kansas’s auditors counted 230 screened on average, against 89 in other murder trials), each side usually has two lawyers, and a guilty verdict is followed by a second trial on the sentence, with its own witnesses and experts. In Maryland about 70% of the extra cost of seeking death fell at the trial stage. A death sentence then brings an automatic review by the state’s highest court, which most other sentences do not get, and years of further challenges that the prisoner can bring.
Seeking death costs more even when no death sentence follows. In Nevada such a case cost $1.2 million, against $775,000 where death was never sought, and in Maryland $1.8 million against $1.1 million. Kansas’s auditors concluded that because the U.S. Supreme Court requires so much of the process, there appeared to be little room to save money by changing it.
Extra cost of a case ending in a death sentence
How to read it: each bar is how much more a murder case ending in a death sentence cost than a similar case where death was not sought, in millions of dollars (Nevada’s is for a sentence not carried out). The other studies measure other things. Sources: Urban Institute (2008); Nevada Legislative Auditor (2014).
| State | Extra cost ($ millions) |
|---|---|
| Maryland | 1.9 |
| Nevada | 0.53 |
Racial disparities in capital sentencing
At the end of 2023, 41% of the people under sentence of death were Black, the Bureau of Justice Statistics reports, against 13.5% of the U.S. population in the Census Bureau’s 2025 estimate. That gap alone does not show bias, since it could reflect differences in the crimes, the defendants’ records or where the cases were tried. The question is whether gaps remain once those are taken into account.
The victim’s raceIn 1990 the U.S. General Accounting Office (GAO) reviewed 28 studies of death sentencing since 1972. In 82% of them, the victim’s race influenced the likelihood of a capital charge or a death sentence, and those who killed white victims were more likely to be sentenced to death than those who killed Black victims. The finding held in studies of high, medium and low quality, and the evidence was stronger at early stages such as charging, where larger samples allowed more rigorous analysis. Legally relevant factors such as aggravating circumstances were influential but “did not explain fully” the disparities.
In Georgia, David Baldus and his colleagues studied more than 2,000 murder cases from the 1970s. One of their models, as the Supreme Court summarized it in McCleskey v. Kemp (1987), found that even after 39 nonracial variables were taken into account, defendants charged with killing white victims were 4.3 times as likely to receive a death sentence as those charged with killing Black victims. The Court assumed the study was statistically valid, but held that to win under the Equal Protection Clause McCleskey had to prove that the decisionmakers in his own case acted with discriminatory purpose, which the study could not show.
How many times higher the odds of a death sentence were when the victim was white
How to read it: each bar is how many times higher the odds of a death sentence were when a victim was white, after the study’s statistical controls; a bar at 1 would mean no difference. The table shows which cases each study compares. The Supreme Court put Georgia’s figure as “4.3 times as likely”; Phillips and Marceau, who later reworked Baldus’s data, describe it as odds. Sources: Baldus and colleagues, as reported in McCleskey v. Kemp (1987); Paternoster and Brame (2003); Unah and Boger (2001).
| Study | Cases compared | Odds multiplier |
|---|---|---|
| Georgia, 1970s (Baldus) | Murder cases, white against Black victims | 4.3 |
| Maryland, 1978–1999 (Paternoster and Brame) | Death-eligible cases, a white victim against none | 3.4 (2.1 in the study’s stepwise model) |
| North Carolina, 1993–1997 (Unah and Boger) | Death-eligible cases, white against non-white victims | 3.5 |
In North Carolina, Wesley Jennings and colleagues matched 1,113 capital trials from 1977 to 2009 on about 50 case characteristics, and the white-victim effect on the jury’s sentence was no longer significant. Their study began after prosecutors had chosen to seek death, though, and in the Maryland study the victim’s race mattered at that choice, not at the sentence.
The defendant’s raceThe evidence on the defendant’s race is less clear. The GAO called it “equivocal”, and the Maryland study found no evidence that the defendant’s race mattered once case characteristics were controlled for. In Washington, though, the study the state’s Supreme Court relied on when it struck down the death penalty in 2018 found that, once other factors were taken into account, Black defendants whose cases reached a death penalty hearing were 3.5 to 4.6 times as likely as others to be sentenced to death, depending on the model.
Where the crime happensWhere a murder happens matters too. In 2013 the Death Penalty Information Center found that 2% of U.S. counties accounted for most of the cases that had led to executions since 1976. In the Maryland study, prosecutors in Baltimore County were more than 13 times as likely to seek death as those in neighboring Baltimore City, even after controlling for the facts of each case. Where the homicide occurs, the study concluded, “matters and matters a great deal.”
Wrongful convictions
The Death Penalty Information Center counts 203 people exonerated from death row since 1973, in 30 states, the latest in July 2026. The National Registry of Exonerations, which counts all crimes, recorded 147 exonerations in 2024, 85 of them for homicide and four of people who had been sentenced to death. Official misconduct played a part in at least 104 of the 147, or 71%, and in 79% of the homicide cases.
Counts miss the innocent who are never cleared, and the chance of being cleared drops sharply once a death sentence is reduced to life. In 2014 Samuel Gross and colleagues modelled this and estimated that if everyone sentenced to death stayed under that sentence indefinitely, at least 4.1% would be exonerated. The authors call the estimate conservative.
Wrongful conviction data
1973–2026
Death-row exonerations since 1973 (Death Penalty Information Center)203
Estimated share of death sentences that were false convictions (Gross et al., 2014)at least 4.1%
Exonerations for all crimes in 2024 (National Registry of Exonerations)147
Of those, with official misconduct71% (at least 104)
Executions for each death-row exoneration (Death Penalty Information Center)about 8
An execution cannot be undone, and errors can take decades to surface. Derrick Jamison received six death warrants during 20 years of wrongful imprisonment in Ohio, one of them within 90 minutes of being carried out; a federal court found that prosecutors had withheld 35 pieces of evidence, the charges were dropped in 2005, and in March 2026 a judge declared him wrongfully imprisoned. Elwood Jones spent 27 years on Ohio’s death row before a judge found in 2022 that prosecutors had withheld evidence; the charges were dropped in 2025. Tommy Lee Walker, a Black man arrested at 19, was sentenced to death by an all-white Dallas jury and executed in 1956 at 21. In January 2026 Dallas County declared him innocent.
The safeguards meant to catch such errors are also why capital cases cost more. Nevada’s auditor traced the extra spending to procedural safeguards “to ensure the sentence is just and free from error”.
The case for the death penalty
Deterrence may still be real
Supporters note that the National Research Council found only that the research cannot tell, so a small deterrent effect could exist unseen. But by the Council’s verdict the research cannot say whether executions decrease homicides, increase them or have no effect, and it advised against using the studies to inform policy.
Some murders deserve death
Many hold that death is the only proportionate punishment for the worst murders, a moral judgment no data can settle, and that it brings victims’ families closure. One study of survivors found those in Minnesota, where the maximum is life without parole, in better physical, psychological and behavioral health than those in Texas, which has the death penalty.
Only execution is certain
An executed prisoner cannot kill again. Of 558 prisoners spared by the 1972 Furman decision, those still in prison killed four prisoners and two officers over 15 years, and one of the 239 later paroled killed again; Marquart and Sorensen concluded the group was not a significant threat to society.
The racial gaps are overstated
Matching cases in North Carolina left no significant white-victim effect on juries’ sentences. But that study began after prosecutors had chosen to seek death, the stage where the GAO found the stronger evidence and where Maryland’s victim-race effect arose.
The system corrects its mistakes
Samuel Gross and colleagues found that the high rate of exoneration on death row appears to be driven by the threat of execution. But most people sentenced to death are later resentenced to life, after which the chance of exoneration “drops sharply”; their model of that effect gives the 4.1% estimate above.
The verdict: what the evidence shows
No one has shown that the death penalty deters crime. In 2012 the National Research Council concluded that research on its effect is “not informative about whether capital punishment decreases, increases, or has no effect on homicide rates”, and recommended that the studies not be used to inform policy. It stressed that this lack of evidence is not evidence for or against deterrence.
The studies that claimed large effects did not hold up when others re-ran them. The 2003 county study behind the estimate of 18 murders prevented per execution gave 18 lives lost when one of its figures was entered as the paper itself describes, and its co-author, splitting the same data by state, found deterrence in 6 of 27 states and more murders in 13. Executions are rare, 25 in 2024 against 20,162 homicide deaths, and Donohue and Wolfers concluded that their effect cannot be reliably told apart from the year-to-year swings in murder.
The other questions have firmer answers. All six state studies of cost found capital cases cost more on average. In 82% of the 28 studies the GAO reviewed in 1990, the victim’s race influenced the likelihood of a capital charge or a death sentence. And 203 people have been exonerated from death row since 1973.
Four claims about the death penalty, against the evidence
Claim“Each execution prevents 18 murders.”
Not shownThe 2003 county study behind the figure gave 18 lives lost instead when one of its figures was entered as the paper describes, and the National Research Council found the research as a whole not informative either way.
Claim“Executing a murderer is cheaper than life in prison.”
Not in these studiesSix state studies each found capital cases cost more on average than similar cases where death was not sought, or than they would without the death penalty, mostly because of the second trial on the sentence, the extra lawyers and the automatic review of a death sentence.
Claim“The racial gaps are overstated.”
Not for the victim’s raceIn 82% of 28 studies reviewed by the GAO in 1990, the victim’s race influenced the likelihood of a capital charge or a death sentence; the GAO called the evidence on the defendant’s race “equivocal”. A North Carolina study found no significant white-victim effect on juries’ sentences once cases were matched, but it began after prosecutors had chosen to seek death.
Claim“The system corrects its mistakes.”
Only in partSince 1973, 203 people have been exonerated from death row, but most people sentenced to death are later resentenced to life, after which exoneration becomes far less likely; one study estimates that at least 4.1% would be exonerated if all stayed under a death sentence.
Download the conclusion
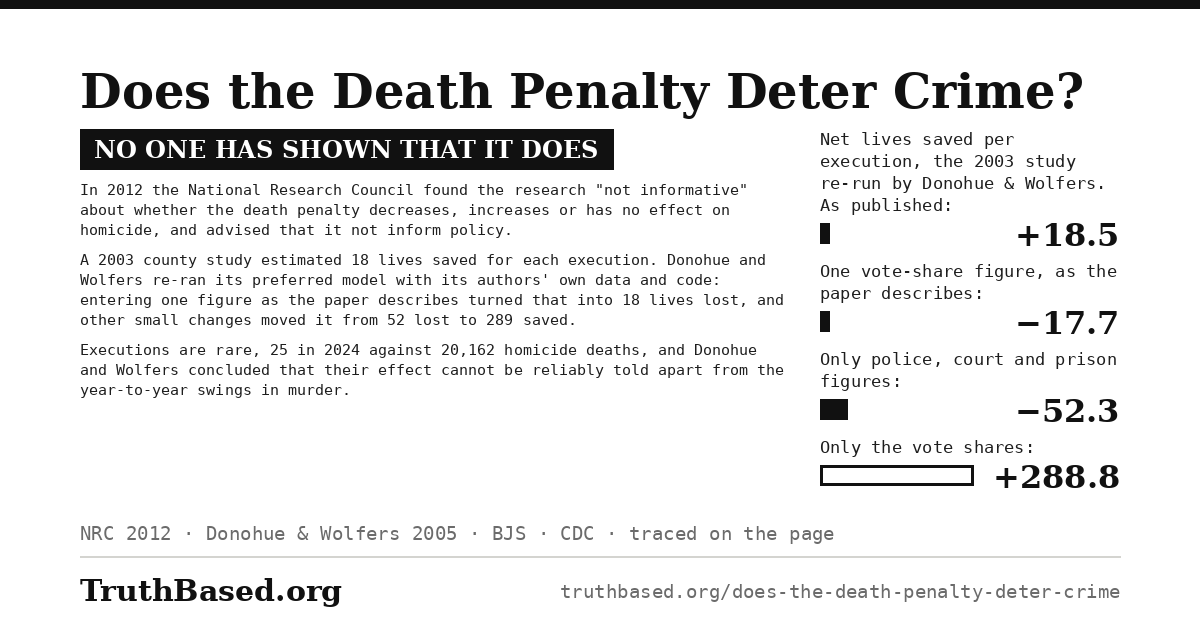
The verdict above as one image, with its chart: the 2003 county study’s preferred model as Donohue and Wolfers re-ran it, 18.5 lives saved per execution as published, 17.7 lost with one vote-share figure as the paper describes, 52.3 lost with only the police, court and prison figures, 288.8 saved with only the vote shares. It is 1,200 by 630 pixels, the size social networks use for link previews; anyone may download and post it.
What would change this conclusion
This article concludes that: (1) no study has shown that the death penalty deters murder, and the research cannot say whether it decreases, increases or has no effect on homicide; (2) the 2003 county study’s 18 lives saved per execution reverses with small changes to its model; (3) capital cases cost more on average in each of six state studies; (4) the victim’s race influenced who faced a capital charge or a death sentence in most studies the GAO reviewed.
These conclusions would be falsified by:
• Studies that account for the punishment a murderer would otherwise get and find an effect of executions on homicide that survives changes to the model
• Cost studies counting every stage of the case that find capital cases cost no more than cases where death is not sought
• Studies following cases from the decision to seek death to the sentence that find no victim-race effect once the facts are taken into account
Sources
Bureau of Justice Statistics. Snell, T.L. Capital Punishment, 2023 – Statistical Tables, NCJ 310309 (July 2025). People under sentence of death at the end of 2023, executions and other removals, the states with statutes, and advance counts of 2024’s executions. bjs.ojp.gov
Death Penalty Information Center. “State by State”, “Life Without Parole” and “Aggravating Factors by State”. 27 states with the death penalty; life without parole available in all of them; state laws that list murder during a kidnapping or an armed robbery among the aggravating factors. deathpenaltyinfo.org deathpenaltyinfo.org deathpenaltyinfo.org
Ehrlich, I. “The Deterrent Effect of Capital Punishment: A Question of Life and Death.” American Economic Review 65(3) (1975); NBER Working Paper 18 (1973). National time series, 1933–1969; 7 or 8 fewer murders for each additional execution a year. nber.org
National Research Council. Blumstein, A., Cohen, J. & Nagin, D. (eds.) Deterrence and Incapacitation: Estimating the Effects of Criminal Sanctions on Crime Rates (1978). The panel’s finding on Ehrlich, as the 2012 report quotes it. nap.nationalacademies.org
Dezhbakhsh, H., Rubin, P.H. & Shepherd, J.M. “Does Capital Punishment Have a Deterrent Effect? New Evidence from Postmoratorium Panel Data.” American Law and Economics Review 5(2): 344–376 (2003). County data, 1977–1996; 18 fewer murders per execution, give or take 10. ideas.repec.org
Berk, R. “New Claims about Executions and General Deterrence: Déjà Vu All Over Again?” Journal of Empirical Legal Studies 2(2): 303–330 (2005). The state-years with more than five executions, about 1% of the data. ideas.repec.org
Shepherd, J.M. “Deterrence versus Brutalization: Capital Punishment’s Differing Impacts among States.” Michigan Law Review 104: 203 (2005). The same county data split by state: deterrence in 6 of 27 states, no effect in 8, more murders in 13. repository.law.umich.edu
Donohue, J.J. & Wolfers, J. “Uses and Abuses of Empirical Evidence in the Death Penalty Debate.” Stanford Law Review 58: 791 (2005); NBER Working Paper 11982 (2006). Re-analysis of the recent studies claiming deterrence, with the 2003 county study’s own data and code. nber.org
National Research Council. Nagin, D.S. & Pepper, J.V. (eds.) Deterrence and the Death Penalty (2012). Review of the deterrence research since the 1978 report; its conclusion and recommendation. nap.nationalacademies.org
Parker, B. “Death Penalty Statutes and Murder Rates: Evidence From Synthetic Controls.” Journal of Empirical Legal Studies 18(3): 488–533 (2021). Seven states that abolished the death penalty against blends of 29 that kept it; no evidence of deterrence. ideas.repec.org
National Institute of Justice. “Five Things About Deterrence” (2016), drawing on Nagin, D.S. “Deterrence in the Twenty-First Century.” Crime and Justice 42 (2013). The certainty of being caught deters more than the severity of the punishment. nij.ojp.gov
Centers for Disease Control and Prevention, National Center for Health Statistics. FastStats: Assault or Homicide (2024 data). 20,162 homicide deaths in 2024. cdc.gov
Death Penalty Information Center. “DPI Year End Report 2025”. Executions in 2025. deathpenaltyinfo.org
Roman, J. et al. The Cost of the Death Penalty in Maryland. Urban Institute (March 2008). 1,136 death-eligible cases; a case ending in a death sentence cost about $1.9 million more than one where death was not sought. urban.org
Nevada Legislative Auditor. Fiscal Costs of the Death Penalty, LA14-25 (December 2014). A sample of 28 Washoe and Clark County murder cases, 2000 to 2012: a case ending in a death sentence that was not carried out cost about $1.3 million, $532,000 more than a case where death was not sought ($775,000). leg.state.nv.us
Collins, P.A., Boruchowitz, R.C., Hickman, M.J. & Larrañaga, M.A. An Analysis of the Economic Costs of Seeking the Death Penalty in Washington State. Seattle University (January 2015). 147 aggravated first-degree murder cases since 1997; cases where death was sought cost $3.07 million on average, against $2.01 million where it was not (2010 dollars). seattleu.edu
Kansas Legislative Division of Post Audit. Costs Incurred for Death Penalty Cases: A K-GOAL Audit of the Department of Corrections (December 2003). 22 cases; the median trial cost of a case ending in a death sentence was more than $500,000, against about $33,000 where death was not sought. kslpa.gov
Cook, P.J. “Potential Savings from Abolition of the Death Penalty in North Carolina.” American Law and Economics Review 11 (2009). North Carolina would have spent almost $11 million less a year on criminal justice, appeals and prisons included, without the death penalty (fiscal years 2005 and 2006). fbaum.unc.edu
Alarcón, A.L. & Mitchell, P.M. “Executing the Will of the Voters? A Roadmap to Mend or End the California Legislature’s Multi-Billion-Dollar Death Penalty Debacle.” Loyola of Los Angeles Law Review 44: S41 (2011). About $4 billion from 1978 to 2011 for 13 executions, and $184 million a year above a system with life without parole as its harshest sentence. digitalcommons.lmu.edu
U.S. Census Bureau. QuickFacts: United States (Vintage 2025 estimates). Black or African American alone, 13.5% of the population. census.gov
U.S. General Accounting Office. Death Penalty Sentencing: Research Indicates Pattern of Racial Disparities, GAO/GGD-90-57 (February 1990). A review of 28 studies. gao.gov
McCleskey v. Kemp, 481 U.S. 279 (1987). The Supreme Court’s summary of the Baldus Georgia studies, and its holding. law.cornell.edu
Phillips, S. & Marceau, J. “Whom the State Kills.” Harvard Civil Rights-Civil Liberties Law Review 55(2) (2020). Baldus’s Georgia cases followed to execution; his 4.3 given as the odds of a death sentence when the victim was white. journals.law.harvard.edu
Paternoster, R., Brame, R. et al. An Empirical Analysis of Maryland’s Death Sentencing System with Respect to the Influence of Race and Legal Jurisdiction: Final Report. University of Maryland (2003). 1,311 death-eligible cases, 1978–1999. aclu-md.org
Unah, I. & Boger, J.C. Race and the Death Penalty in North Carolina: An Empirical Analysis, 1993–1997. Initial Findings (April 2001). Death-eligible cases; the odds of a death sentence 3.5 times as high when the victim was white. ncchurches.org
Jennings, W.G., Richards, T.N., Smith, M.D., Bjerregaard, B. & Fogel, S.J. “A Critical Examination of the ‘White Victim Effect’ and Death Penalty Decision-Making from a Propensity Score Matching Approach: The North Carolina Experience.” Journal of Criminal Justice 42: 384–398 (2014). 1,113 capital trials, 1977–2009. digitalcommons.usf.edu
State v. Gregory, 427 P.3d 621 (Wash. 2018), relying on Beckett and Evans’s study of Washington death sentences, 1981–2014. The opinion quotes Beckett’s summary of her findings: special sentencing proceedings involving Black defendants were between 3.5 and 4.6 times as likely to result in a death sentence as those involving other defendants, other factors taken into account. justia.com
Dieter, R.C. The 2% Death Penalty: How a Minority of Counties Produce Most Death Cases at Enormous Costs to All. Death Penalty Information Center (October 2013). 2% of counties and the cases that led to executions since 1976. dpic-cdn.org
Death Penalty Information Center. Innocence database, and its “Innocence” page. 203 people exonerated from death row since 1973, the latest in July 2026; one exoneration for every eight executions. deathpenaltyinfo.org deathpenaltyinfo.org
National Registry of Exonerations. 2024 Annual Report. 147 exonerations, 85 for homicide, four of people sentenced to death; official misconduct in at least 104 (71%), and in 79% of the homicide cases. exonerationregistry.org
Gross, S.R., O’Brien, B., Hu, C. & Kennedy, E.H. “Rate of false conviction of criminal defendants who are sentenced to death.” Proceedings of the National Academy of Sciences 111(20): 7230–7235 (2014). At least 4.1% of those sentenced to death would be exonerated if all stayed under that sentence; the authors call it a conservative estimate. repository.law.umich.edu
Death Penalty Information Center, “Ohio Court ‘Formally Vindicates’ Death Row Exoneree 41 Years After Conviction” (18 March 2026), its innocence database’s entry for Elwood Jones, and “Posthumous Declarations of Innocence”. Derrick Jamison, Elwood Jones, and Tommy Lee Walker (the Dallas County Commissioners Court’s resolution of 21 January 2026). deathpenaltyinfo.org deathpenaltyinfo.org dallascounty.civicweb.net
Gallup. “Americans: ‘Eye for an Eye’ Top Reason for Death Penalty” (23 October 2014). Asked why, 35% of Americans who favor the death penalty named “an eye for an eye” and 14% “they deserve it”. news.gallup.com
Armour, M.P. & Umbreit, M.S. “Assessing the Impact of the Ultimate Penal Sanction on Homicide Survivors: A Two State Comparison.” Marquette Law Review 96: 1 (2012). Survivors in Minnesota and Texas. scholarship.law.marquette.edu
Marquart, J.W. & Sorensen, J.R. “A National Study of the Furman-Commuted Inmates: Assessing the Threat to Society from Capital Offenders.” Loyola of Los Angeles Law Review 23: 5 (1989). 558 prisoners spared by the 1972 Furman decision, followed for 15 years. digitalcommons.lmu.edu
Cite this article
TruthBased.org. “Does the Death Penalty Deter Crime?” Published March 2026. https://www.truthbased.org/does-the-death-penalty-deter-crime