Political Fact Checks
Is Voter Fraud a Real Problem?
1,619 cases on Heritage’s list since 1982, about 7 per 10 million federal ballots, and what 2020 found.
Groups & Crime
Do Immigrants Commit More Crime?
No: 674 undocumented and 303 legal immigrants incarcerated per 100,000 against 1,195 native-born in Cato’s estimates from the 2024 American Community Survey, Texas arrest rates say the same, and why Europe differs.
Economics & Policy
U.S. Federal Spending: What We Spend and What It Costs
FY2026 outlays, deficit and debt, and why interest now exceeds defense.
Is There Really a Border Crisis?
CBP’s counts from FY2000 to FY2025: what an encounter counts, how much repeat crossing Title 42 added, how many crossers are caught, and each side’s claims tested against the numbers.
Jump to the verdict ↓
The short answer
It depends what you count. CBP’s headline number counts events, not people. Counted that way, 2021, 2022 and 2023 were the three highest years in a Border Patrol series that runs back to 1960. Counted as attempted crossings, on DHS’s own estimates of how many it catches, the years around 2000 were probably higher. What changed was who came and what happened next. The fall began in January 2024, and the months since February 2025 are the lowest in monthly figures going back to October 1999.
What CBP Reports
U.S. Customs and Border Protection publishes its border counts at cbp.gov, and they come in two kinds. Until March 2020 the Border Patrol reported apprehensions between ports of entry, and the people found inadmissible at the ports were counted separately. Since then CBP has reported “encounters”, which add Title 42 expulsions and, in the combined totals, the people processed at ports of entry. The chart and the first column of the table use the one series that runs the whole way, Border Patrol between ports of entry; the second column is the combined total. Both count events, so a person caught three times counts three times, in 2000 as in 2023.
How to read it: each bar is one fiscal year of Border Patrol encounters at the southwest border, in thousands, between ports of entry only; the encounters are events, not people. The three red bars, FY2021 to FY2023, are the years above FY2000; FY2022 is the record. Every value is in the first column of the table below. Source: CBP, as compiled by Pew Research Center (2 February 2026).
| Fiscal year | Border Patrol, between ports of entry | Border Patrol plus ports of entry |
|---|---|---|
| 2000 | 1,643,679 | |
| 2001 | 1,235,718 | |
| 2002 | 929,809 | |
| 2003 | 905,065 | |
| 2004 | 1,139,282 | |
| 2005 | 1,171,396 | |
| 2006 | 1,071,972 | |
| 2007 | 858,638 | |
| 2008 | 705,005 | |
| 2009 | 540,865 | |
| 2010 | 447,731 | |
| 2011 | 327,577 | |
| 2012 | 356,873 | |
| 2013 | 414,397 | |
| 2014 | 479,371 | |
| 2015 | 331,333 | |
| 2016 | 408,870 | |
| 2017 | 303,916 | |
| 2018 | 396,579 | |
| 2019 | 851,508 | 977,509 |
| 2020 | 400,651 | 458,088 |
| 2021 | 1,659,206 | 1,734,686 |
| 2022 | 2,206,436 | 2,378,944 |
| 2023 | 2,045,838 | 2,475,669 |
| 2024 | 1,530,523 | 2,135,005 |
| 2025 | 237,538 | 443,671 |
The first column is apprehensions to February 2020 and apprehensions plus Title 42 expulsions from March 2020. The second adds the people processed at ports of entry; a blank means none is given, and FY2019’s is the apprehensions and inadmissibles CBP reported separately that year, added together. CBP’s first announcement for FY2025, on 7 October 2025, gave a preliminary 237,565; its published data show 237,538, the lowest since FY1970’s 201,780.
Sources: first column, CBP as compiled by Pew Research Center (2 February 2026); second column, CBP’s totals, FY2019 from its FY2019 figures, FY2020 to FY2022 as reported by Just the News (October 2022), FY2023 to FY2025 as reproduced by the House Committee on Homeland Security (November 2025).
The decline, month by monthThe highest month in Pew’s compilation of CBP’s monthly figures, which runs from October 1999, was December 2023, with 249,740 Border Patrol encounters, or about 302,000 once arrivals at ports of entry are added. The lowest was July 2025, at 4,592. August 2026, the latest month CBP has published, brought 8,870, which is 96% below December 2023.
The fall did not begin on January 20, 2025. Border Patrol encounters halved in a single month, from 249,740 in December 2023 to 124,215 in January 2024. They dropped again after the Biden administration restricted asylum claims in June 2024, from 117,905 in May to 56,400 in July, and again after Trump took office, from 47,320 in December 2024 to 8,349 in February 2025.
How to read it: each point is one month of Border Patrol encounters at the southwest border, in thousands, between ports of entry only, from October 2022 to December 2025. The table below gives every month of FY2023 to FY2025; October to December 2025 were 7,989, 7,348 and 6,478. Source: CBP, as compiled by Pew Research Center (2 February 2026).
| Month | FY 2023 | FY 2024 | FY 2025 |
|---|---|---|---|
| Oct | 205,134 | 188,749 | 56,515 |
| Nov | 207,680 | 191,106 | 46,609 |
| Dec | 222,018 | 249,740 | 47,320 |
| Jan | 129,513 | 124,215 | 29,105 |
| Feb | 130,521 | 140,641 | 8,349 |
| Mar | 163,672 | 137,473 | 7,179 |
| Apr | 183,921 | 128,895 | 8,376 |
| May | 171,382 | 117,905 | 8,724 |
| Jun | 99,538 | 83,532 | 6,066 |
| Jul | 132,642 | 56,400 | 4,592 |
| Aug | 181,054 | 58,009 | 6,317 |
| Sep | 218,763 | 53,858 | 8,386 |
| Fiscal year | 2,045,838 | 1,530,523 | 237,538 |
The fiscal year runs from October to September, so FY2025 begins in October 2024. Source: CBP, as compiled by Pew Research Center (2 February 2026); August 2026 from CBP’s release of 16 September 2026.
Who is crossingCBP sorts the people it encounters into single adults, individuals in family units (each person counted), unaccompanied children and, at the ports, accompanied minors. In FY2023 about three in five of its 2.48 million southwest border encounters were single adults, a third were people in families and about 6% unaccompanied children (CBP’s year-end figures as ABC15 Arizona reported them). Unaccompanied children have since fallen by about 95%: more than 130,000 Border Patrol apprehensions in FY2023, about 11,000 a month (Congressional Research Service), against just under 5,700 from February to November 2025, about 570 a month (the Center for Immigration Studies’ sum of CBP’s monthly figures). In January 2026, 90% of the Border Patrol’s southwest border apprehensions were single adults (DHS).
Why the Numbers Mislead
Title 42 was a public health order the Centers for Disease Control and Prevention issued on March 20, 2020; it let CBP expel people within hours, without a hearing or a removal order, and it ended on May 11, 2023. A removal under immigration law (Title 8) bars re-entry for five or ten years, twenty after a second removal, and crossing again after one is a federal crime. An expulsion carried none of that, so a person expelled on Monday could try again on Tuesday and be counted again.
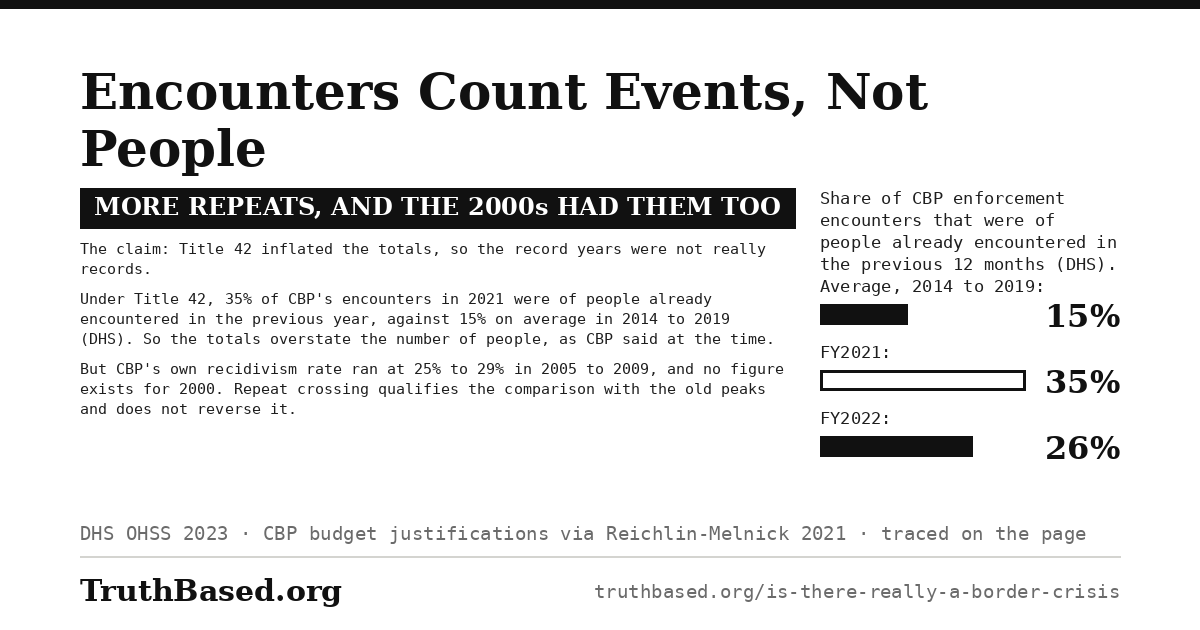
DHS’s statistics office counts the repeats. In FY2021, 35% of CBP’s encounters were of people encountered in the previous 12 months; in FY2022 it was 26%, in the first months of Title 42 (March to September 2020) 45%, and the 2014 to 2019 average was 15%. CBP’s recidivism rate, the share of people caught more than once in a year, went from 7% in FY2019 to 26% in FY2020 and 27% in FY2021.
CBP said at the time that “total encounters somewhat overstate the number of unique individuals arriving at the border”. Its count of people not encountered in the previous 12 months was 845,307 for FY2021 through July, in more than 1.3 million southwest border encounters, against 796,400 at the same point in FY2019; for FY2022 DHS counts 1,742,000 such people in 2,341,000, about three in four.
None of this means the 2000s were counted more cleanly. CBP’s recidivism rate stood at 25% in FY2005 and 27% to 29% from FY2006 to FY2009, then fell to 14% by FY2014 and 7% in FY2019, so under Title 42 repeat crossing went back to where it had been fifteen years earlier. DHS counts 2005 as the first year with data and the Immigration and Naturalization Service’s figures stop in 1989, so for FY2000 there is nothing to go on; its 1.64 million apprehensions were events too.
Sources: DHS Office of Homeland Security Statistics, Immigration Enforcement Actions for FY2022, and DHS’s 2017 estimates of border security (2005 as the first year with data); CBP’s monthly updates, and its enforcement statistics for the recidivism rate from FY2014. The rates for FY2005 to FY2009 are CBP’s budget-justification figures as charted in a 2021 court declaration by Aaron Reichlin-Melnick of the American Immigration Council; the figures to 1989 are as the Cato Institute reports them.
Download this conclusion: repeat crossings
CBP One
This card takes apart the idea that Title 42 repeat crossings turned the record years into ordinary ones: repeats were 35% of encounters in 2021 against 15% in the years before, and CBP’s own recidivism rate was as high in the mid-2000s as under Title 42. Anyone may download it and post it.
From January 2023 CBP’s phone app, CBP One, let people book appointments at ports of entry, 1,450 a day, and those processed with one are counted in the combined total as encounters at a port; more than 936,500 people had booked through it by the end of December 2024. The Trump administration ended the appointments on January 20, 2025.
Earlier Peaks Had Different Crossers
High crossing numbers are not new. Border Patrol apprehensions at the southwest border reached about 1.62 million in FY1986 and 1,643,679 in FY2000, a record until FY2021 (Congressional Research Service).
Who was crossing has changed more than how many. In FY2000, 98% of those apprehended were Mexican nationals, most of them single adult men, and few asked for asylum, the Congressional Research Service found from CBP’s tables. In FY2019 it counted 166,458 Mexicans among 851,508 apprehensions, about 20%, while Pew Research Center counted 607,774 from Guatemala, Honduras and El Salvador, about 71%. In FY2023, by the Migration Policy Institute’s count, 51% of encounters at and between southwest border ports of entry were of people from beyond Mexico and those three countries, up from 12% three years earlier.
People from farther away are harder to return. DHS’s statistics office says encounters from outside Mexico and northern Central America posed extra challenges because repatriation agreements, logistics and feasibility differ, and DHS could not verify those nationalities electronically, which made removals slower.
Where people arrive has changed too. CBP officers encountered about 430,000 people at southwest border ports of entry in FY2023, two and a half times FY2022’s 173,000. Nationwide, by CBP’s own figures, 15% of encounters were at ports of entry in FY2021 and 46% in FY2024. The headline total adds these people, who came to an official crossing, to those the Border Patrol caught crossing between ports.
What the Data Cannot Tell Us
“Got-aways” are people seen or tracked crossing illegally, by agents, sensors, cameras or footprints, who were neither caught nor turned back; the term is defined in federal law and used by DHS. Anyone never detected is missing from the count, and Raul Ortiz, then Chief of the Border Patrol, told Congress in 2023 that it probably misses 10% to 20%.
CBP released its yearly counts to Fox News under a Freedom of Information Act request: 136,808 nationwide in FY2020, then 387,398 in FY2021, 606,131 in FY2022 and 670,674 in FY2023, about 1.66 million over three years. Secretary Mayorkas gave Congress 389,155 for FY2021, as Fox News reported, and more than 600,000 for FY2023. The Congressional Budget Office put FY2023 at 860,000, taking 750,000 detected got-aways and adding 15% for people never seen. DHS had still published no official figure for FY2023 or FY2024 by September 2025, and CBO’s January 2026 outlook puts people entering without meeting a CBP official at about 50,000 in 2025.
Got-aways rose under Title 42 and fell once it ended. Using CBP data obtained by the Cato Institute, the Migration Policy Institute counts nearly 73,500 in April 2023, the last full month of Title 42, and 32,800 two months later, and sets the rise beside the rise in repeat crossing. Cato’s David Bier put February 2024 at about 21,800.
An encounter is not an outcome either. People sent to immigration court joined a backlog of about 3.75 million cases at the end of 2024, where the average pending case in February 2025 had waited 636 days. It has fallen since, to 3,092,988 at the end of August 2026, of which 2,278,978 were people with asylum applications on file. Judges granted asylum in 38.2% of decisions in August 2024, 19.2% in August 2025 and 5.5% in June 2026, a fall TRAC traces back to before the change of administration. The Border Patrol has reported no releases since May 2025.
Sources: 6 U.S.C. 223 and DHS’s Border Security Metrics Report (the definition); CBP’s counts as released to Fox News; CBO’s Demographic Outlooks of January 2024 and January 2026; the Migration Policy Institute and the Cato Institute (the monthly counts); TRAC (tracreports.org), from the immigration courts’ own records.
Political Claims vs. Evidence
Enforcement data contradict it. In FY2021 to FY2024, which began in October 2020 under Trump, DHS carried out more than 4.7 million repatriations (removals, returns and Title 42 expulsions), most of them expulsions; like encounters, they count events, not people. The Migration Policy Institute found that the Biden administration’s nearly 4.4 million by February 2024 already exceeded every presidential term since George W. Bush’s second, and that after Title 42 ended in May 2023 it removed or returned 775,000 people in 12 months, the most in any fiscal year since 2010.
Encounters did reach records, and for much of FY2024 the Border Patrol released most people it apprehended to await a court hearing (Congressional Research Service).
“Trump Solved the Border Crisis”In Trump’s first term the Border Patrol’s count more than doubled in FY2019, to 851,508, the most since FY2007. He declared a national emergency on February 15, 2019; the monthly count peaked that May, had fallen by more than three quarters by February 2020, before the pandemic, and rose again under Title 42.
On his first day back, January 20, 2025, Trump declared a national emergency at the border, ordered the military to help, suspended asylum for people crossing it, revived Remain in Mexico and ended CBP One; DHS extended expedited removal nationwide the next day. CBP reports that since May 2025 the Border Patrol has released none of the people it apprehends, a count that leaves out ports of entry.
The fall began a year earlier. Border Patrol encounters halved in January 2024 and by December 2024 were 81% below the December 2023 peak (Part 1). FY2025’s 237,538, the lowest total since 1970, starts in October 2024, and by CBP’s own count 72% of it came in the 111 days before Trump took office. The monthly counts cannot separate either administration’s measures from the other’s or from Mexico’s enforcement.
“Encounters at Record Highs”True of encounters. On the Border Patrol series, the same measure in every year and one that never included ports of entry, FY2021, FY2022 and FY2023 are each above FY2000’s 1,643,679 (Part 1).
Three things qualify the comparison; only the third may reverse it, and only for crossings. First, encounters count events, and under Title 42 about a quarter of the people caught were caught more than once in the year (26% in FY2020 and 27% in FY2021, against 7% in FY2019); the same was true of FY2005 to FY2009, at 25% to 29%, and no such figure exists for FY2000.
Second, until the Obama years most people caught were allowed to return voluntarily, mostly to Mexico; by FY2023 more than half of encounters were of people from beyond Mexico and northern Central America, who are harder to return (Migration Policy Institute).
Third, an encounter is someone who was caught. DHS estimates that the Border Patrol caught 42.5% of would-be crossers in 2000, a majority only since 2013, and 78% on average in 2018 to 2020. At 42.5%, FY2000’s 1.64 million apprehensions imply about 3.9 million attempts; FY2022’s 2.21 million encounters plus 606,131 known got-aways make about 2.8 million. The older estimates are model-based and uncertain, and attempts are not people either.
The strongest case on each side
Even without ports of entry, the Border Patrol recorded 7.4 million encounters in FY2021 to FY2024, the most for any four years since 1960; the most before FY2021 was 6.1 million, in FY1997 to FY2000, and CBP’s figures cannot show repeat crossing was rarer then (Part 2). Got-aways, people seen crossing but not caught, passed 600,000 a year in FY2022 and FY2023, and nobody knows who they were (Part 4). With a court backlog of about 3.75 million cases at the end of 2024, release to await a hearing could mean years in the country. New York City spent $8.2 billion on asylum seekers from July 2022 to June 2025, $3.1 billion of it the state’s, and CBO puts the surge’s net cost to state and local governments at $9.2 billion in 2023.
The counts qualify this. The records are of encounters, and on DHS’s estimates the years around 2000 had more attempted crossings, most of them successful (Part 5); and got-aways fell from nearly 73,500 in April 2023 to 32,800 two months later (Part 4).
The case that it was notThe headline totals overstate the number of people. CBP counted 154,288 people not encountered in the previous 12 months among July 2021’s 212,672 encounters, and for FY2021 as a whole DHS found encounters up 82% on 2019 but unique people up 30%. Enforcement was heavy (Part 5). Asking for asylum is lawful whether a person arrives at a port of entry or between them (8 U.S.C. 1158). And CBO projected that the surge would add $8.9 trillion, or 2.4%, to nominal GDP over 2024 to 2034 and cut federal deficits by $0.9 trillion, an estimate it calls very uncertain.
The counts qualify this too. Repeat crossing ran as high in FY2005 to FY2009, so fewer people than encounters does not make 2021 to 2023 ordinary (Part 2); applying is not being granted, and immigration judges granted 38.2% of asylum decisions in August 2024 (Part 4); and CBO’s budget gain is federal, while the costs it measures fall on states and cities.
The verdict: what the evidence shows
It depends what you count. CBP counts encounters, which are events, and by that count 2021, 2022 and 2023 were the three highest years in a Border Patrol series that runs back to 1960. Counted as attempted crossings they were probably not the highest: on DHS’s estimates of how many crossers the Border Patrol catches, 42.5% in 2000 against 78% in 2018 to 2020, FY2000 had about 3.9 million attempts and FY2022 about 2.8 million.
What changed was who came and what happened next. In FY2000, 98% of those caught were Mexican nationals, most returned voluntarily; by FY2023 more than half were from beyond Mexico and northern Central America, harder to return, and for much of FY2024 the Border Patrol released most people it caught to await a hearing in a court backlog that reached about 3.75 million cases.
Three common claims, against the evidence
Claim“Biden had open borders.”
Not by any enforcement countDHS carried out more than 4.7 million repatriations in FY2021 to FY2024, and by February 2024 the Biden administration’s 4.4 million already exceeded every presidential term since George W. Bush’s second (Migration Policy Institute). Encounters did reach records, and for much of FY2024 most people the Border Patrol caught were released to await a hearing.
Claim“Encounters hit record highs.”
True of encountersOn the Border Patrol series, the same measure every year, FY2021 to FY2023 are each above FY2000’s 1,643,679. Repeat crossing inflated the count under Title 42 (27% caught more than once in FY2021, against 7% in FY2019), but FY2005 to FY2009 ran at 25% to 29%, and no figure exists for 2000. Counted as attempted crossings, FY2000 had about 3.9 million against about 2.8 million in FY2022.
Claim“Trump solved the border crisis.”
PartlyThe months since February 2025 are the lowest in monthly figures going back to October 1999, and the Border Patrol reports releasing nobody it caught since May 2025, a count that leaves out ports of entry. But the fall began in January 2024, a year before he took office; 72% of FY2025’s 237,538, the lowest year since 1970, came in its first 111 days, under Biden; and the counts cannot separate either administration’s measures from Mexico’s enforcement.
Download the conclusion
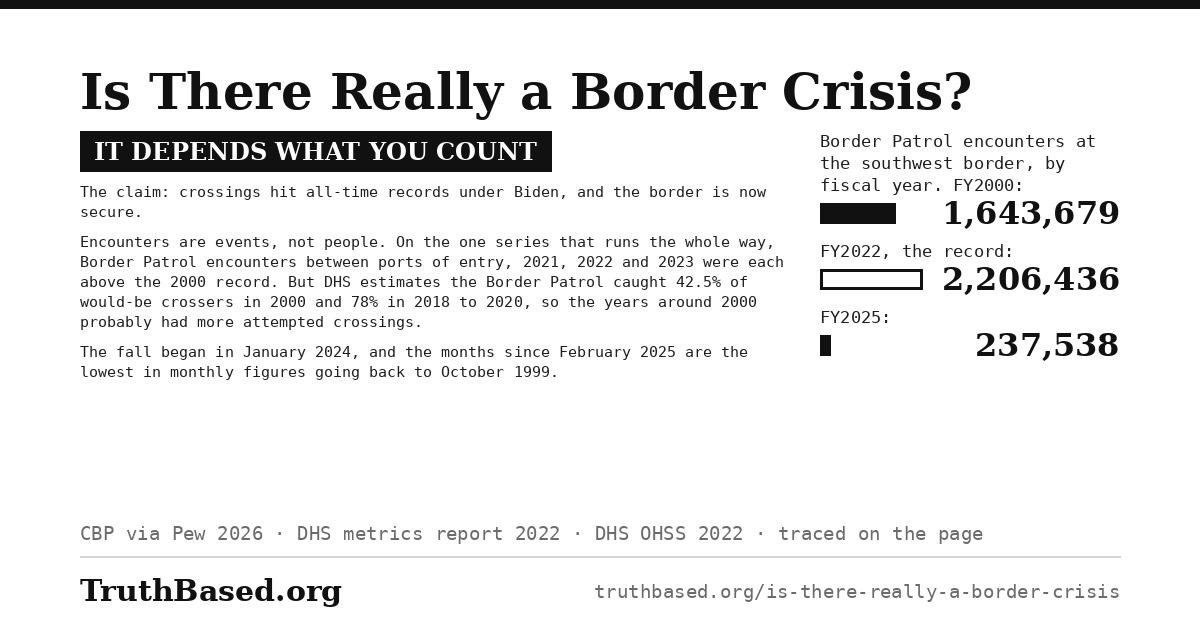
The verdict above as one image, with three Border Patrol counts at the southwest border: 1,643,679 in FY2000, 2,206,436 in FY2022, the record, and 237,538 in FY2025, the lowest since 1970. It is 1,200 by 630 pixels, and anyone may download it and post it.
What would change this conclusion
This article concludes that: (1) FY2021 to FY2023 were the three highest years for encounters on the like-for-like Border Patrol series, inflated by repeat crossing about as much as FY2005 to FY2009 were; (2) on DHS’s estimated catch rates, there were more attempted crossings around 2000 than in any recent year; (3) enforcement continued through the surge, and the fall began a year before the change of administration; (4) the surge raised state and local costs, and CBO projects that it lowers federal deficits.
These conclusions would be falsified by:
• A DHS or CBO estimate of attempted crossings putting FY2021 to FY2023 above the years around 2000
• A count of people, not events, showing fewer people encountered in FY2022 or FY2023 than in FY2005 to FY2009
• Revised monthly counts showing that the fall began after January 2025
• CBO revising the surge’s federal effect to a net cost, or its state and local effect to a net gain
Sources
U.S. Customs and Border Protection. Nationwide Encounters. CBP’s encounter statistics and its definitions of encounters, apprehensions, inadmissibles and Title 42 expulsions. The Border Patrol series in both charts and tables is CBP’s, read through Pew’s compilation below and CBP’s own fiscal-year pages. cbp.gov
U.S. Customs and Border Protection. Nationwide Encounters, Fiscal Year 2024 and Fiscal Year 2025. CBP’s monthly southwest border apprehensions for FY2024 and FY2025, which match the monthly table; the FY2024 page is at cbp.gov/newsroom/stats/nationwide-encounters-fy2024. cbp.gov
U.S. Customs and Border Protection. Southwest Border Migration FY2019. Source for FY2019’s 851,508 apprehensions and 126,001 inadmissibles, reported separately that year and added together in the table (977,509), and for its note that inadmissibles include people presenting themselves at ports to seek humanitarian protection. cbp.gov
Just the News. Record 2.4 million migrants illegally crossed border in FY2022, almost 4 million total under Biden, 21 October 2022. Reports CBP’s combined southwest border totals for FY2020 to FY2022 (458,088; 1,734,686; 2,378,944); cited for the CBP figures it carries. justthenews.com
House Committee on Homeland Security. FY2025 Numbers Show Lowest SW Border Apprehensions in Half a Century, Border Brief factsheet, released 13 November 2025. Reproduces CBP’s combined southwest border totals for FY2023, FY2024 and FY2025 (2,475,669; 2,135,005; 443,671). Cited for the CBP figures it carries, not for its commentary. homeland.house.gov
U.S. Customs and Border Protection. Lowest fiscal year for Border Patrol apprehensions since 1970, 7 October 2025. Source for the preliminary FY2025 figure of 237,565, for FY1970’s 201,780, and for CBP’s split of the year: 172,026 apprehensions, 72%, in its first 111 days and 65,539 in the 254 days after. cbp.gov
U.S. Customs and Border Protection. CBP Releases December 2023 Monthly Update, 26 January 2024. Source for December 2023’s 302,034 southwest border encounters and 249,785 Border Patrol encounters; CBP’s published series now gives the Border Patrol figure as 249,740. cbp.gov
U.S. Customs and Border Protection and Department of Homeland Security. Trump administration delivers 16 straight months of zero releases at the border, 16 September 2026. Source for August 2026’s 8,870 Border Patrol apprehensions at the southwest border and for the run of zero Border Patrol releases from May 2025, a count that leaves out ports of entry. cbp.gov
Pew Research Center. Gramlich, Migrant encounters at the U.S.-Mexico border are at their lowest level in more than 50 years, 2 February 2026. CBP’s Border Patrol series compiled by fiscal year from FY1960 and by month from October 1999 to December 2025: the source for both charts, both Part 1 tables, the monthly figures in Parts 1 and 5, the four-year totals in Part 6, the finding that FY2025 was the lowest fiscal year since 1970, and Mexico’s increased enforcement, which it reports has played a significant role in the fall (Part 5). pewresearch.org
U.S. Customs and Border Protection. Nationwide Encounters data dictionary, September 2023. Source for CBP’s four demographic groups and for family-unit figures counting individuals, not families. cbp.gov
ABC15 Arizona. Breaking down the record number of migrant encounters at the southern border, October 2023. Reports CBP’s FY2023 year-end figures: 2,475,669 southwest border encounters, about 1.5 million single adults, about 821,000 individuals in family units, over 137,000 unaccompanied children, and about 430,000 encounters at ports of entry. abc15.com
Congressional Research Service. Unaccompanied Alien Children: An Overview, R43599, updated 5 September 2024. Source for unaccompanied children apprehended by the Border Patrol between southwest border ports of entry exceeding 130,000 a year since FY2021. everycrsreport.com
Center for Immigration Studies. Arthur, Proof the Border Is Historically Secure Can Be Found in CBP’s Monthly Stats, 22 December 2025. Source for the unaccompanied-children figure: just under 5,700 Border Patrol apprehensions in the ten months from February to November 2025, its sum of CBP’s monthly data. CIS advocates for immigration restriction; cited for the CBP figures it carries. cis.org
U.S. Department of Homeland Security. Historic 9th Straight Month of Zero Releases at the Border, 4 February 2026. Source for the share of single adults, 90%, among January 2026’s Border Patrol apprehensions at the southwest border. dhs.gov
Congressional Research Service. COVID-Related Restrictions on Entry into the United States Under Title 42: Litigation and Legal Considerations, LSB10874, updated 13 March 2023. Source for the CDC’s order of March 20, 2020 and for expulsions without access to screening. The American Immigration Council’s guide to Title 42 expulsions (americanimmigrationcouncil.org, 24 May 2022) gives the order’s end on May 11, 2023 and says people expelled to Mexico within hours could try again. everycrsreport.com
Congressional Research Service. The Statutory Bars to Reentry into the United States, IF12484, 30 August 2023. Source for the re-entry bars after a removal: five years after an expedited or arrival removal, ten after other removals, twenty after a second removal. everycrsreport.com
8 U.S.C. 1326, Reentry of removed aliens. The statute making re-entry after removal a federal crime. law.cornell.edu
DHS Office of Homeland Security Statistics. Immigration Enforcement Actions: 2022, Annual Flow Report, November 2023. Source for the share of CBP enforcement encounters that were of people encountered in the previous 12 months (26% in 2022, 35% in 2021, 45% from March 20 to September 2020, an average of 15% for 2014 to 2019); for its count of 1,742,000 such people in 2,341,000 southwest border encounters in 2022; for DHS’s 1,474,000 repatriations and expulsions in 2022; and for the extra difficulty of returning people from beyond Mexico and northern Central America. ohss.dhs.gov
DHS Office of Immigration Statistics. Efforts by DHS to Estimate Southwest Border Security between Ports of Entry, September 2017. Source for 2005 as the first year for which DHS has recidivism data. ohss.dhs.gov
U.S. Customs and Border Protection. CBP Releases July 2021 Operational Update, 12 August 2021. Source for CBP’s statement that total encounters somewhat overstate the number of unique individuals, for July 2021’s 212,672 encounters of 154,288 people not encountered in the previous 12 months, and for 845,307 such people in FY2021 through July against 796,400 at the same point in FY2019. cbp.gov
U.S. Customs and Border Protection. CBP Enforcement Statistics, Fiscal Year 2020, Fiscal Year 2021 and Fiscal Year 2024. CBP’s own tables: the Border Patrol’s recidivism rate by fiscal year, 14% in FY2014 falling to 7% in FY2019, then 26% in FY2020 and 27% in FY2021 (the FY2020 and FY2021 pages), and nationwide encounters by component for FY2021 and FY2024, from which the ports of entry’s 15% and 46% are computed (the FY2024 page, cbp.gov/newsroom/stats/cbp-enforcement-statistics-fy2024). cbp.gov
Reichlin-Melnick, A. (American Immigration Council). Declaration filed 11 August 2021 in Huisha-Huisha v. Mayorkas, 1:21-cv-00100-EGS. Charts CBP’s border recidivism rate from its congressional budget justifications: 25% in FY2005 and 27% to 29% in FY2006 to FY2009. The American Immigration Council advocates for immigrants; cited for the CBP figures it reproduces. aclu.org
Cato Institute. Nowrasteh, Border Patrol Criminal Arrest Statistics in Historical Perspective, 28 December 2021. Source for the Immigration and Naturalization Service’s recidivism figures, which run from 1937 to 1989 and stop there. cato.org
Migration Policy Institute. Title 42 Postmortem: U.S. Pandemic-Era Expulsions Policy Did Not Shut Down the Border. Source for the monthly got-away counts obtained by the Cato Institute (nearly 73,500 in April 2023 and 32,800 two months later), set beside the Border Patrol’s recidivism rate (7% in FY2019, 27% in FY2021), and for its explanation that Title 42 short-circuited the consequences of a formal removal. migrationpolicy.org
U.S. Customs and Border Protection. CBP Releases December 2024 Monthly Update, 14 January 2025. Source for the more than 936,500 people who had booked appointments through CBP One by the end of December 2024. CBP One’s 1,450 daily appointment slots are from the Associated Press’s report of the same day, Border crossings in December trend low as Biden administration wraps up, as carried by DTN (dtnpf.com/agriculture/web/ag/news/world-policy/article/2025/01/15/border-crossings-december-trend-low). cbp.gov
Congressional Research Service. Immigration: Recent Apprehension Trends at the U.S. Southwest Border, R46012, 19 November 2019. Source for FY1986’s about 1.62 million Border Patrol apprehensions at the southwest border, for FY2000’s 98% Mexican nationals, and for FY2019’s 166,458 Mexican nationals among 851,508 apprehensions. congress.gov
Congressional Research Service. Immigration: Apprehensions and Expulsions at the Southwest Border, R46999, 22 December 2021. Source for the FY2000 record of 1,643,679 Border Patrol apprehensions and for FY2021’s 1,659,206, the highest in CBP’s history. congress.gov
Congressional Research Service. Recent Migration to the United States from Central America: Frequently Asked Questions, R45489, updated 29 January 2019. Source for earlier crossers as “predominantly single, adult males from Mexico”: “In the past, single adult males made up over 90% of apprehended aliens.” tracreports.org
Pew Research Center. After surging in 2019, migrant apprehensions at U.S.-Mexico border fell sharply in fiscal 2020, 4 November 2020. Source for FY2019’s 607,774 apprehensions of people from Guatemala, Honduras and El Salvador. pewresearch.org
Migration Policy Institute. Shifting Patterns and Policies Reshape Migration to U.S.-Mexico Border in Major Ways in 2023. Source for the FY2023 nationality split: 51% of southwest border encounters of people from beyond Mexico and northern Central America, against 12% three years earlier. migrationpolicy.org
DHS Office of Homeland Security Statistics. Fiscal Year 2021 Southwest Border Enforcement Report, August 2022. Source for DHS’s estimate that the Border Patrol caught 78% of would-be crossers on average in 2018 to 2020, for about 1.9 million successful evasions a year in 2000 to 2006, for encounters up 82% and unique people up 30% between 2019 and 2021, and for DHS’s inability to verify nationalities from beyond Mexico and northern Central America electronically. ohss.dhs.gov
U.S. Department of Homeland Security. Border Security Metrics Report: 2022 (2021 data), 3 July 2023. Source for DHS’s modelled estimate that the Border Patrol caught 42.5% of would-be crossers in 2000 and a majority only from 2013, and for the got-away definition it uses. ohss.dhs.gov
6 U.S.C. 223, Border security metrics. The statute that defines a got-away. uscode.house.gov
Congressional Budget Office. The Demographic Outlook: 2024 to 2054, January 2024. Source for CBO’s 860,000 people entering without meeting a CBP official in FY2023 (750,000 detected got-aways, raised by 15% for people never seen) and for the Border Patrol chief’s testimony that the count probably missed 10% to 20%. The House Committee on Homeland Security’s post of 3 January 2024 names him, Raul Ortiz, and the March 2023 hearing. cbo.gov
Congressional Budget Office. The Demographic Outlook: 2026 to 2056, January 2026. Source for about 50,000 people entering without meeting a CBP official in 2025, and for DHS having published no official got-away figure for FY2023 or FY2024 by September 2025. cbo.gov
Fox News. New data reveals illegal immigrants eluding Border Patrol spiked under Biden, surpassing predecessors, 15 May 2024. Reports CBP’s nationwide got-away counts by fiscal year, released to Fox News under a Freedom of Information Act request: 136,808 in FY2020; 387,398, 606,131 and 670,674 in FY2021 to FY2023. CBP does not publish the series. foxnews.com
Fox News. Mayorkas testifies more than 389,000 migrant “gotaways” at border, 28 April 2022. Reports Secretary Mayorkas’s figure of 389,155 got-aways for FY2021, given to the House Judiciary Committee on 28 April 2022. foxnews.com
Office of Senator Roger Marshall. ICYMI: Sen. Marshall Grills Sec. Mayorkas at Homeland Security Hearing: Confirms Over 600K Gotaways In FY’23, 31 October 2023. Quotes Mayorkas’s answer that got-aways in FY2023 were “over 600,000”. marshall.senate.gov
Cato Institute. Bier, Border Patrol: 70 Percent Drop in Successful Evasions Since Title 42 Ended, 4 March 2024. Source for February 2024’s about 21,800 got-aways (21,758) and the 73,463 of April 2023, from CBP’s counts. cato.org
TRAC (Transactional Records Access Clearinghouse). Immigration Court Quick Facts. Source for the backlog of 3,092,988 active cases at the end of August 2026 and the 2,278,978 people in it with asylum applications on file, from the courts’ own case records. tracreports.org
TRAC (Transactional Records Access Clearinghouse). Immigration Court Backlog: Overall Down, Asylum Backlog Up, 20 March 2025. Source for 3,747,675 cases at the end of December 2024 and for the 636-day average wait of cases pending at the end of February 2025. tracreports.org
TRAC (Transactional Records Access Clearinghouse). Immigration Court Asylum Grant Rates Cut in Half, 18 November 2025, and Asylum Denials Rise to 94% Amid the Remaking of the Immigration Court, 31 August 2026. Source for asylum grant rates of 38.2% in August 2024, 19.2% in August 2025 and 5.5% in June 2026, and for the fall beginning before the change of administration. The November 2025 report is at tracreports.org/reports/766/. tracreports.org
DHS Office of Homeland Security Statistics. Immigration Enforcement Actions annual flow reports for 2021 and 2023, with CBP’s September 2024 monthly update of 22 October 2024. Source for the repatriations of FY2021 to FY2024: 1,338,000 in 2021, 1,474,000 in 2022 (the 2022 report above), over 1.2 million in 2023, and CBP’s preliminary count of over 700,000 removals and returns in FY2024, more than 4.7 million together, of which Title 42 expulsions were 1,071,000 in 2021, 1,104,000 in 2022 and 580,000 in 2023. The 2021 report is at ohss.dhs.gov/sites/default/files/2023-12/2022_1114_plcy_enforcement_actions_fy2021.pdf. ohss.dhs.gov
Migration Policy Institute. Chishti and Bush-Joseph, Comparing the Biden and Trump Deportation Records, June 2024. Source for the Biden administration’s nearly 4.4 million repatriations by February 2024, more than in any presidential term since George W. Bush’s second (5 million); for the 775,000 removals and returns in the 12 months after Title 42 ended, the most in any fiscal year since 2010; and for most people caught until the Obama years being returned voluntarily. migrationpolicy.org
Congressional Research Service. The Impact of the “Securing the Border” Rule on Migrant Encounters and Processing, IN12417, updated 2 December 2024. Source for most Border Patrol encounters being processed with a notice to appear and released for much of FY2024 (77% in December 2023, 53% in May 2024), and for the June 2024 rule. congress.gov
Proclamation 9844, Declaring a National Emergency Concerning the Southern Border of the United States, 15 February 2019 (84 FR 4949). Source for the date of the first-term emergency declaration. federalregister.gov
Congressional Research Service. Recent White House Actions on Immigration, LSB11265, updated 10 February 2025. Source for the January 20, 2025 measures: the national emergency, the military’s role, the asylum proclamation, the return of the Migrant Protection Protocols and the end of CBP One. congress.gov
U.S. Department of Homeland Security. Designating Aliens for Expedited Removal, 90 FR 8139, 24 January 2025. The notice extending expedited removal nationwide, effective on 21 January 2025 and published on 24 January. federalregister.gov
U.S. Customs and Border Protection. CBP Releases Operational Fiscal Year 2021 Statistics, 3 January 2022. Source for southwest border encounters up 82% and unique people up 30% between FY2019 and FY2021, as CBP reported them. cbp.gov
8 U.S.C. 1158, Asylum. The statute under which a person may apply for asylum whether or not at a designated port of arrival. law.cornell.edu
Congressional Budget Office. Effects of the Immigration Surge on the Federal Budget and the Economy, July 2024. Source for the $0.9 trillion reduction in deficits over 2024–2034 ($1.2 trillion more revenue against $0.3 trillion more mandatory spending and interest), which CBO calls very uncertain, and for its note that states and localities face additional costs. The $8.9 trillion, or 2.4%, addition to nominal GDP is in the Director’s statement on the June 2024 budget update (cbo.gov/publication/60359). cbo.gov
Congressional Budget Office. Effects of the Surge in Immigration on State and Local Budgets in 2023, June 2025. Source for the surge’s net direct cost to state and local governments of $9.2 billion in 2023. cbo.gov
New York City Comptroller. Accounting for Asylum Seeker Services: Fiscal Impacts. Source for the city’s spending on asylum seekers, $1.474 billion, $3.752 billion and $3.020 billion in its 2023 to 2025 fiscal years (July 2022 to June 2025), $8.2 billion together, of which the city books $3.1 billion as State funding ($1.26 billion received by 31 July 2025). comptroller.nyc.gov
Cite this article
TruthBased.org. “Is There Really a Border Crisis?” Updated September 2026. https://www.truthbased.org/is-there-really-a-border-crisis