Religion & Society
Are Religious Countries Better Off?
No. The more religious countries are mostly the poorer ones, and the evidence points to insecurity and inequality driving both.
Economics & Policy
Is the Gender Wage Gap Real?
Why women earn less: discrimination, choice, hours, or all three?
Economics & Policy
Is College Still Worth It?
Wage premiums, debt loads, and ROI by major and institution.
Which Countries Are the Most Educated?
This page compares measures of how educated countries are. It ranks 46 countries by the share of adults aged 25 to 64 with a tertiary qualification in 2025, using figures from the Organisation for Economic Co-operation and Development (OECD). It then sets that ranking against years of schooling, test scores, numbers of researchers and literacy. It also looks at the countries at the bottom, the gaps between women and men, and spending.
Jump to the verdict ↓
The short answer
It depends what you count. On the share of adults aged 25 to 64 with a tertiary qualification, Canada leads 46 countries in figures from the Organisation for Economic Co-operation and Development (OECD), at 64%. In the OECD’s tests of 15-year-olds, Singapore and four Chinese provinces and municipalities score highest. On years of schooling, Germany leads the United Nations’ list of 193 countries, at 14.3 years. Yet only 35% of its adults hold a tertiary qualification.
The ranking on tertiary qualifications
Tertiary qualifications are most common in Canada, at 64% of adults aged 25–64, and least common in South Africa, at 8%. These are the 2025 figures for 46 countries in Table A1.1 of the OECD’s Education at a Glance 2026, published on 29 September 2026. A qualification counts as tertiary at levels 5 to 8 of the International Standard Classification of Education (ISCED): short-cycle tertiary, bachelor’s, master’s or doctoral. The table below sorts the figures from highest to lowest. The OECD average is 43%.
Share of adults aged 25–64 with a tertiary qualification, 2025
| # | Country | Tertiary % (25–64) | Note |
|---|---|---|---|
| 1 | Canada | 64% | |
| 2 | Ireland | 59% | |
| 3 | Japan | 58% | |
| 3 | South Korea | 58% | |
| 5 | Luxembourg | 55% | |
| 5 | United Kingdom | 55% | |
| 7 | Australia | 54% | |
| 8 | United States | 52% | |
| 9 | Israel | 51% | |
| 9 | Sweden | 51% | |
| 11 | Lithuania | 50% | |
| 11 | Norway | 50% | |
| 13 | Belgium | 47% | |
| 14 | Denmark | 46% | |
| 14 | Netherlands | 46% | |
| 14 | Switzerland | 46% | |
| 17 | France | 45% | |
| 18 | Iceland | 44% | 2023 |
| 18 | New Zealand | 44% | |
| 20 | Finland | 43% | |
| 21 | Estonia | 42% | |
| 21 | Spain | 42% | |
| 23 | Latvia | 41% | |
| 24 | Poland | 40% | |
| 25 | Austria | 38% | |
| 26 | Chile | 37% | 2024 |
| 27 | Bulgaria | 36% | |
| 28 | Germany | 35% | |
| 28 | Greece | 35% | |
| 28 | Slovenia | 35% | |
| 31 | Portugal | 33% | |
| 32 | Hungary | 32% | |
| 33 | Croatia | 31% | |
| 34 | Slovak Republic | 30% | |
| 35 | Colombia | 29% | |
| 35 | Czechia | 29% | |
| 37 | Costa Rica | 28% | |
| 37 | Türkiye | 28% | |
| 39 | Argentina | 23% | ISCED-97 |
| 40 | Brazil | 22% | 2024 |
| 40 | Italy | 22% | |
| 40 | Mexico | 22% | |
| 43 | Romania | 19% | |
| 44 | India | 16% | ISCED-97 |
| 45 | Indonesia | 13% | 2023 |
| 46 | South Africa | 8% |
Source: OECD, Education at a Glance 2026, Table A1.1. Figures are for 2025 unless the note gives another year. Figures for Argentina, India and Indonesia come from the International Labour Organization’s database; the rest come from national labour force surveys compiled by an OECD network. Argentina and India use the older ISCED-97 classification. The table gives no figure for China, Peru or Saudi Arabia.
Adults aged 25–34The ranking changes when you isolate younger adults. In the same report, South Korea leads among 25–34 year-olds at 71% in 2025, against an OECD average of 49%. Canada and Japan follow at 68%. Among South Koreans aged 55–64 the share is 35%, so the gap between the generations is 36 percentage points.
The leader changes with the measure
Other measures each put a different country first: years of schooling, what 15-year-olds can do in tests, and how many people work in research. The tests are the Programme for International Student Assessment (PISA) of the Organisation for Economic Co-operation and Development (OECD). The tertiary ranking, by contrast, counts qualifications.
| Measure | Leader | Next | Year and source |
|---|---|---|---|
| Adults aged 25–64 with a tertiary qualification | Canada, 64% | Ireland, 59% | 2025; OECD, Education at a Glance 2026, 46 countries |
| Adults aged 25–34 with a tertiary qualification | South Korea, 71% | Canada and Japan, 68% | 2025; same report |
| Mean years of schooling, people aged 25 and over | Germany, 14.3 | Switzerland, 13.9 | 2023; UN Human Development Report 2025, 193 countries |
| PISA mathematics, 15-year-olds | B-S-J-Z (China), 612 | Singapore, 563 | 2025; OECD, PISA 2025, 91 countries and economies |
| PISA reading, 15-year-olds | Singapore, 535 | B-S-J-Z (China), 527 | 2025; same |
| PISA science, 15-year-olds | B-S-J-Z (China), 597 | Singapore, 560 | 2025; same |
| Researchers per million people | Liechtenstein, 18,130 | South Korea, 9,472 | 2023; UNESCO Institute for Statistics |
B-S-J-Z (China) is four provinces and municipalities of China, not the whole country: Beijing, Shanghai, Jiangsu and Zhejiang. Researchers are counted in full-time equivalents.
Definition matters
A low share of adults with a tertiary qualification does not mean a poorly educated workforce, as Germany shows. Germany ranks 28th of the 46 countries on tertiary qualifications. Its share is 35%. Yet its adults average 14.3 years of schooling, more than any other country’s in the Human Development Report of the United Nations (UN). About 1.2 million people were in apprenticeships in Germany’s dual vocational training system at the end of 2025.
Download this section
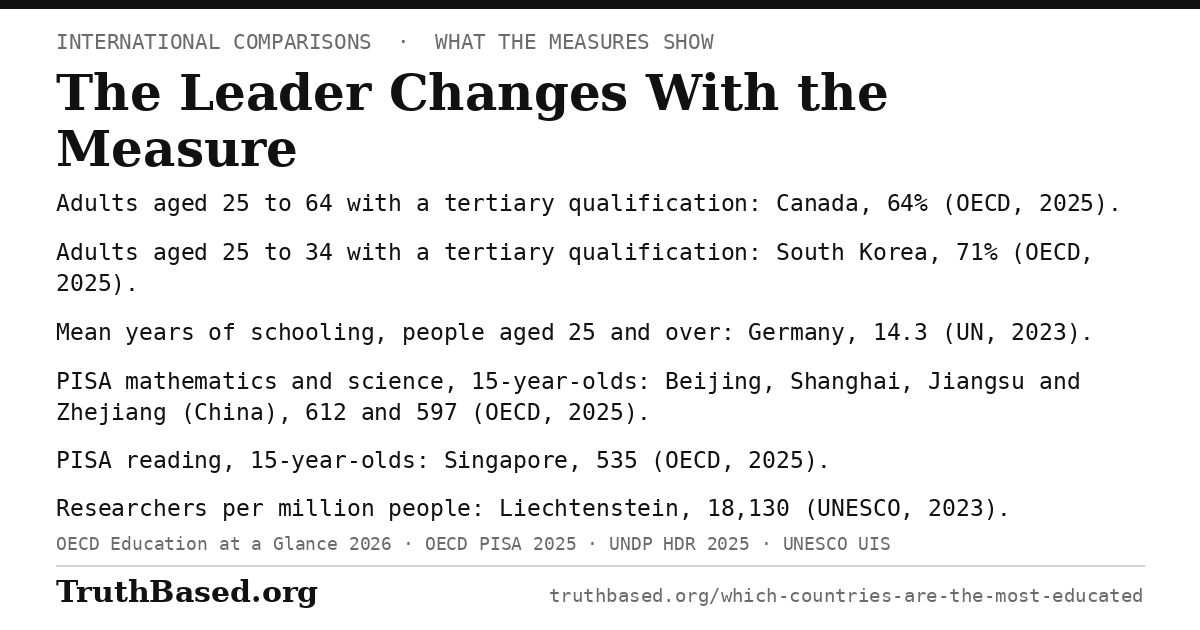
The table above as one image, giving the leader on each of the seven measures with its figure, year and source. The image is 1,200 by 630 pixels, and anyone may download it and post it.
Years of schooling against test scores
Across all 83 countries with both figures, the correlation between adults’ years of schooling and mathematics scores in the OECD’s Programme for International Student Assessment (PISA) is 0.74. On that scale 1 is a perfect match and 0 is no relationship, so countries whose adults have more years of schooling tend to score higher. Among the 38 OECD members the correlation is 0.61. A comparison of countries like this cannot show whether more schooling raises scores.
The two measures describe different people. The United Nations’ Human Development Report gives each country’s mean years of schooling, which describes adults: the average years of education received by people aged 25 and over. PISA tests what 15-year-olds can do, so it describes today’s teenagers.
Even so, more years of schooling do not guarantee higher test scores, as the eight countries below show. Among the eight, the four highest scorers, Singapore, Japan, South Korea and Estonia, have the fewest years of schooling. But the eight are a selection.
| Country | Mean years of schooling | PISA mathematics |
|---|---|---|
| Singapore | 12.0 | 563 |
| Japan | 12.7 | 525 |
| South Korea | 12.7 | 522 |
| Estonia | 13.6 | 508 |
| Canada | 13.9 | 485 |
| Germany | 14.3 | 464 |
| United States | 13.9 | 463 |
| Iceland | 13.9 | 450 |
| OECD average | 463 |
Sources: United Nations Development Programme, Human Development Report 2025 (mean years of schooling, 2023); OECD, PISA 2025 Results (Volume I), Table I.1 (mathematics).
Singapore’s adults average 12.0 years of schooling, the fewest of the eight. Yet in PISA 2025 its students outscored every other country’s in all three subjects. Iceland’s adults average 13.9 years, among the most in the world, but its students scored below the OECD average in every subject. Its mathematics score was 450, against an OECD average of 463. Across the 35 OECD members whose results can be compared since 2015, the average mathematics score fell 9 points between 2022 and 2025.
Mean years of schooling against PISA mathematics score, eight selected countries
Among adults, qualifications and skills do not always match either. Across OECD countries, around 18% of adults with low skills in literacy, numeracy and adaptive problem solving hold a tertiary qualification, according to the OECD’s Survey of Adult Skills.
The countries at the bottom
The countries at the bottom are mostly in Sub-Saharan Africa. Of the 15 countries with the lowest adult literacy rates in the latest figures of the United Nations Educational, Scientific and Cultural Organization (UNESCO), 13 are in Sub-Saharan Africa. The remaining two are Afghanistan and Pakistan. In Niger, the average adult has received 1.4 years of schooling, the lowest figure in the United Nations’ Human Development Report.
| Country | Adult literacy rate | Mean years of schooling |
|---|---|---|
| Niger | 38% | 1.4 years |
| Chad | 28% | 2.3 years |
| South Sudan | 35% | 5.7 years |
| Burkina Faso | 37% | 2.3 years |
| Mali | 44% | 1.6 years |
| Afghanistan | 37% | 2.5 years |
| Ethiopia | 51.8% | 2.4 years |
Sources: UNESCO, International Literacy Day 2025 factsheet (adult literacy rates, people aged 15 and over, latest year available between 2015 and 2024); United Nations Development Programme, Human Development Report 2025 (mean years of schooling, people aged 25 and over, 2023; 2020 for Mali and 2008 for South Sudan); UNESCO, Global Education Monitoring Report 2026 (out-of-school numbers).
The World Bank’s 2022 estimate, a simulation of the pandemic’s effect, puts learning poverty in Sub-Saharan Africa at about 89%, up from 86% before the pandemic. Learning poverty is the share of children who cannot read and understand a simple text by age 10. It counts children out of school as well as those in school who have not learned to read.
UNESCO also counts 273 million children, adolescents and youth of school age out of school in 2024, 3% more than in 2015. Three quarters of them live in Sub-Saharan Africa or Central and Southern Asia.
UNESCO’s 2026 report points to population growth and conflict. In low-income countries the school-age population has doubled since 2000, and the number out of school has risen 29% since 2015. Conflict disrupts both schooling and the counting of it.
The gaps between women and men
Among young adults, women are now ahead. In every OECD country with a figure, women aged 25–34 are more likely than men of that age to hold a tertiary qualification. On average across the OECD, the shares in 2025 are 56% for women and 43% for men. The gap is 13 percentage points.
The gap is widest in Iceland, at 26 points in 2023. Slovenia follows at 24 points and Estonia at 23. Israel comes next, at 21 points. The gap is narrowest in Mexico, at 2 points. Among the partner countries in the OECD’s figures, India is the only one where young men are ahead, at 28% against 25%.
In some other countries, men are ahead. The United Nations Educational, Scientific and Cultural Organization (UNESCO) calls Afghanistan “the only country in the world where secondary and higher education is strictly forbidden to girls and women”. Since taking power in August 2021, the Taliban have barred girls from school beyond the primary level, and since 20 December 2022 they have barred women from university.
In Chad, Niger and Burkina Faso, fewer women than men enrol in tertiary education. UNESCO’s adjusted gender parity index for tertiary enrolment is 1 when women and men enrol at the same rate. It is 0.39 in Chad (2020) and 0.64 in Niger (2019). In Burkina Faso it is 0.74 (2024).
Women are also nearly two-thirds of the world’s adults who cannot read. By UNESCO’s count, they were 466 million of the 739 million in 2024.
Spending and test scores
Spending matters up to a point. The Organisation for Economic Co-operation and Development (OECD) compared spending with scores in its report on its Programme for International Student Assessment (PISA) for 2025. It set each country’s cumulative spending per student from age 6 to 15, adjusted for differences in prices, against its average science score. Countries that spend more tend to score higher, but above about 85,000 US dollars per student spending and scores begin to decouple.
National income matters too: across all participants, half of the variation in average scores goes with income per person, though only 9% among OECD countries.
The OECD adds two warnings. The comparison is between countries at one point in time, so it “should not be interpreted as causal”. And more money helps only when it is used well. In the OECD’s words, “Increased spending needs to be accompanied by the effective allocation and use of financial resources if it is to translate into improvement in education.”
What the tertiary figures count
The tertiary figures follow the International Standard Classification of Education (ISCED) 2011, levels 5 to 8, except for Argentina and India, which use ISCED-97. Level 5 is short-cycle tertiary education, and ISCED sets its minimum length at two years, so shorter programmes do not count.
Short-cycle qualifications explain Canada’s lead. They are the highest qualification of 25% of Canadian adults, against an average of 7% across the Organisation for Economic Co-operation and Development (OECD). Counting only bachelor’s degrees or higher, Canada’s share is 39% and Ireland’s is the highest, at 57%.
Data years vary. Most figures in Table A1.1 are for 2025, but Brazil’s and Chile’s are for 2024, and Iceland’s and Indonesia’s for 2023. The table gives no figure for China; the latest in the OECD’s database is 19%, for 2020.
The OECD’s figures cover 46 countries. For the rest of the world, this page uses mean years of schooling from the United Nations’ Human Development Report, which covers 193 countries. It also uses the literacy rates of the United Nations Educational, Scientific and Cultural Organization (UNESCO).
The verdict: what the evidence shows
It depends what you count, because each measure puts a different country first. Canada has the largest share of adults with a tertiary qualification among the 46 countries in figures from the Organisation for Economic Co-operation and Development (OECD). That is because 25% of its adults hold a short-cycle qualification as their highest. In the OECD’s Programme for International Student Assessment (PISA), Singapore and four Chinese provinces and municipalities score highest. Germany has the most years of schooling in the United Nations’ Human Development Report, while 35% of its adults hold a tertiary qualification.
Niger’s adults average 1.4 years of schooling, the fewest in the Human Development Report, against Germany’s 14.3. Of the 15 countries with the lowest adult literacy rates, 13 are in Sub-Saharan Africa.
Across the 83 countries with both figures, more years of schooling go with higher PISA mathematics scores, though a comparison between countries cannot show whether more schooling raises scores.
Five claims, against the evidence
Claim“Canada is the most educated country in the world.”
On one measureCanada has the largest share of adults aged 25 to 64 with a tertiary qualification, 64%, of 46 countries in figures from the Organisation for Economic Co-operation and Development (OECD). On years of schooling and on test scores, other countries lead.
Claim“More years in school do not mean better results.”
Not across countriesA hand-picked eight can look that way. Across all 83 countries with both figures, more years of adult schooling go with higher mathematics scores in the Programme for International Student Assessment (PISA), a correlation of 0.74.
Claim“Few degrees means a poorly educated workforce.”
Not in GermanyOnly 35% of German adults hold a tertiary qualification, but they average 14.3 years of schooling, the most in the United Nations’ Human Development Report. About 1.2 million people in Germany were in apprenticeships at the end of 2025.
Claim“Spending more on schools raises scores.”
Up to a pointIn PISA 2025, countries that spend more per student tend to score higher in science. But above about 85,000 US dollars per student from age 6 to 15, spending and scores begin to decouple. The OECD says the comparison is not causal.
Claim“Men are better educated than women.”
Not among young adults in the OECDIn every OECD country with a figure, women aged 25 to 34 are more likely than men to hold a tertiary qualification. In 2024, women were 466 million of the world’s 739 million adults who could not read.
Download the conclusion
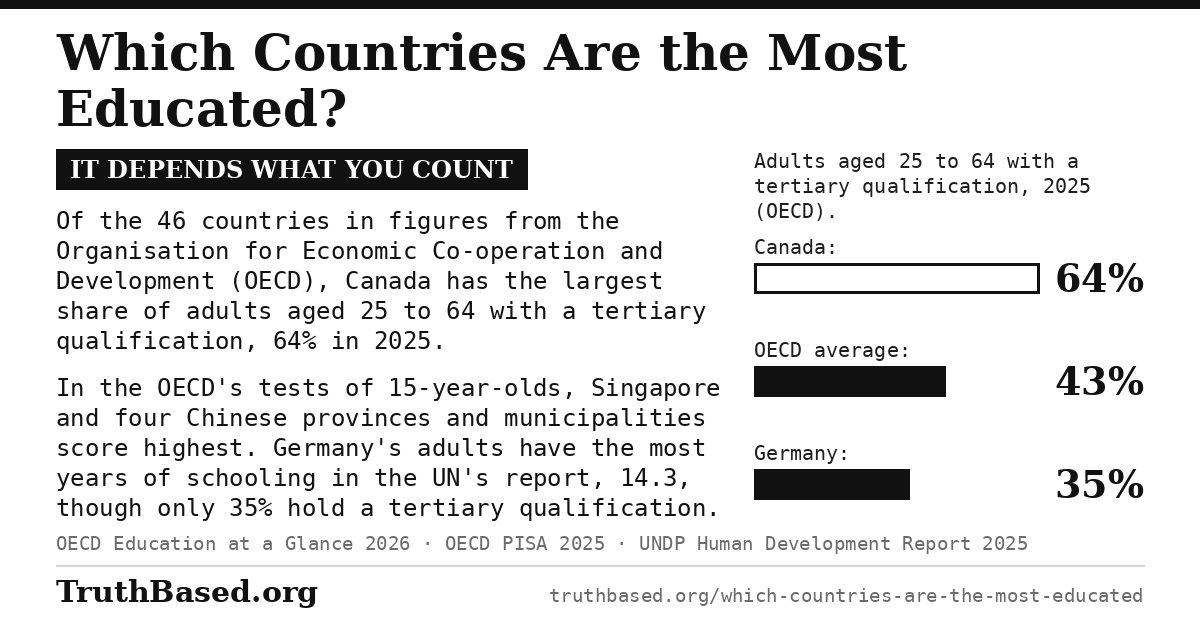
The verdict above as one image. Its three bars give the share of adults aged 25 to 64 with a tertiary qualification in 2025: Canada 64%, the OECD average 43% and Germany 35%. The image is 1,200 by 630 pixels, the size social networks use for link previews, and anyone may download it and post it.
What would change this conclusion
This article concludes that: (1) Canada has the largest share of adults aged 25 to 64 with a tertiary qualification among the 46 countries in the OECD’s figures; (2) other measures put other countries first: South Korea among adults aged 25 to 34, Singapore and the four Chinese provinces and municipalities in PISA, Germany in years of schooling and Liechtenstein in researchers per million people; (3) across the 83 countries with both figures, more years of adult schooling go with higher PISA mathematics scores.
These conclusions would be falsified by:
• OECD figures for China, Peru or Saudi Arabia, which Table A1.1 lacks, showing a share above Canada’s 64%
• Figures for the same year in which one country led on qualifications, years of schooling and test scores together, which would give the question a single answer
• A later round of PISA in which countries whose adults have more years of schooling no longer tend to score higher
Sources
OECD. Education at a Glance 2026: OECD Indicators. OECD Publishing, Paris, 29 September 2026. Chapter A1, “To what level have adults studied?”, Tables A1.1, A1.2 and A1.3. Source for the share of adults aged 25–64 with a tertiary qualification in 46 countries, the OECD average, the data years, the ISCED-97 and International Labour Organization notes, the short-cycle shares, the figures for 25–34 year-olds and by sex, and the 18% of low-skilled adults with a tertiary qualification. The figures for 55–64 year-olds and China’s 2020 figure are from the OECD Data Explorer, which the report says holds the most recent data. The OECD averages for 25–34 year-olds are the ones in the report’s text. The rows headed “OECD average” in Tables A1.2 and A1.3 print lower figures for 2025, which match the Data Explorer’s averages for 2023. The gaps between young women and men are calculated from the Data Explorer’s unrounded shares. oecd.org
OECD. PISA 2025 Results (Volume I): Future-Ready Students. PISA, OECD Publishing, Paris, 2026; released 8 September 2026. Source for the mathematics, reading and science scores (Table I.1), B-S-J-Z (China), the OECD average and its change between 2022 and 2025, the six countries whose results carry a caution, and the comparison of spending per student with science scores. More than 760,000 students in 91 countries and economies took part, and science was the focal domain. oecd.org
UNDP. Human Development Report 2025: Statistical Annex and composite indices time series. United Nations Development Programme, 2025. Source for mean years of schooling in 2023, the “Average number of years of education received by people ages 25 and older”, for 193 countries. Joined with the PISA 2025 mathematics scores for the 83 countries with both figures to give the correlations in the section “Years of schooling against test scores”. hdr.undp.org
UNESCO. International Literacy Day 2025: Promoting literacy in the digital era (factsheet). UNESCO, September 2025. Source for the 15 countries with the lowest adult literacy rates and their rates, and for the 739 million adults who lacked basic literacy skills in 2024, 466 million of them women. unesco.org
UNESCO. Global Education Monitoring Report 2026: “Access and equity”. UNESCO, 2026. Source for the 273 million out of school in 2024, the 3% rise since 2015, the three quarters in Sub-Saharan Africa and Central and Southern Asia, the doubling of the school-age population in low-income countries since 2000, the 29% rise in their out-of-school numbers since 2015, and the effect of conflict. unesco.org
UNESCO. “Protecting the right to education for all Afghans”, and press release “Afghanistan: Four years on, 2.2 million girls still banned from school”, 14 August 2025. Source for UNESCO’s description of Afghanistan, the bar on girls’ schooling beyond the primary level and the university ban of 20 December 2022. unesco.org
UNESCO Institute for Statistics. Education and science, technology and innovation data, February 2026 release. Source for researchers per million inhabitants in full-time equivalents (SDG indicator 9.5.2), 2023, and the adjusted gender parity index for tertiary enrolment. uis.unesco.org
World Bank and partners. The State of Global Learning Poverty: 2022 Update. Conference edition, 23 June 2022. Source for the definition of learning poverty and the estimate for Sub-Saharan Africa: 86% before the pandemic and about 89% after it, by simulation. worldbank.org
Statistisches Bundesamt (Destatis). “Duale Berufsausbildung 2025: Top-Beruf bei Männern erneut Kfz-Mechatroniker, bei Frauen medizinische Fachangestellte”. Press release no. 275, 6 August 2026. Source for the 1.2 million people in dual vocational training at the end of 2025 (1,211,800, on final results). destatis.de
UNESCO Institute for Statistics. International Standard Classification of Education: ISCED 2011. Montreal, 2012. Source for the two-year minimum length of short-cycle tertiary education (paragraph 213). Copy hosted by OpenEMIS: openemis.org
Cite this article
TruthBased.org. “Which Countries Are the Most Educated?” Updated October 2026. https://www.truthbased.org/which-countries-are-the-most-educated