Science & Media Accuracy
Is Climate Change Real and Human-Caused?
The IPCC puts 2011–2020 about 1.1 °C above 1850–1900 on four temperature records, and its best estimate of the human share at all of the warming.
Health & Medicine
Is Ultra-Processed Food Bad for You?
Two feeding trials, the cohort studies of death and disease, and which kinds of ultra-processed food carry the clearest risk.
Science & Perception
Is the Mandela Effect Real?
Shared false memories, the records, and the first controlled study of the effect.
How Dangerous Is Nuclear Power?
The claim is that nuclear power is one of the most dangerous ways to make electricity, because of Chernobyl, Fukushima and its waste. This page compares deaths per unit of electricity across sources, separates counted deaths from projected ones, and sets out the strongest case against nuclear power.
Jump to the verdict ↓
The short answer
Far less dangerous than fossil fuels and, in figures from the non-profit website Our World in Data, about as safe as wind and solar. For the same amount of electricity, coal has caused about 800 times as many deaths as nuclear power, and gas about 90 times as many, mostly through air pollution. Few radiation deaths have been counted. At Chernobyl there were fewer than 50 by 2005, plus 15 from thyroid cancer. At Fukushima there was one, though 2,350 more deaths, mostly linked to the evacuation, were certified. Even Greenpeace’s projection of Chernobyl’s eventual toll, 93,000, would still leave nuclear below gas.
This article is about civilian nuclear power. Weapons, weapons testing and uranium mining outside the power supply chain are not covered here.
How the comparison is made
Counting accidents makes a source that produces little electricity look safe because it is small, so the standard measure is deaths per terawatt-hour of electricity produced. A terawatt-hour is about the electricity 150,000 people in the European Union use in a year.
How to read it: deaths per terawatt-hour of electricity, on a logarithmic scale, where each tenfold rise takes the same space. Red bars are fossil fuels. Source: Our World in Data, using Markandya and Wilkinson (2007) for fossil fuels and biomass and Sovacool et al. (2016) for wind and solar, and its own calculation for nuclear and hydropower, 1965 to 2021.
| Source | Deaths per terawatt-hour |
|---|---|
| Brown coal | 32.72 |
| Coal | 24.62 |
| Oil | 18.43 |
| Biomass | 4.63 |
| Gas | 2.82 |
| Hydropower | 1.30 |
| Wind | 0.04 |
| Nuclear | 0.03 |
| Solar | 0.02 |
The fossil fuel figures, from Markandya and Wilkinson (2007, The Lancet), are mostly not accidents but deaths from air pollution. The pollution is chiefly small particles, many formed from the sulphur dioxide and nitrogen oxides that burning releases. Of coal’s 24.62 deaths per terawatt-hour, accidents account for 0.12. Markandya and Wilkinson assessed European plants with modern pollution controls. So for much of the world’s coal fleet, the gap between coal and nuclear is if anything understated.
Nuclear’s 0.03 is the opposite: Our World in Data, produced with researchers at the University of Oxford, built it entirely from deaths at Chernobyl and Fukushima. It counted 433 at Chernobyl, the upper end of its own calculation, and 2,314 at Fukushima, the toll as of September 2020. All but one of the Fukushima deaths were among evacuees.
Two other methods give other figures, and all three are more than 30 times below gas. Markandya and Wilkinson put nuclear at 0.074 in Europe, mostly estimated cancer deaths plus deaths in mining, milling and generation. Sovacool et al.’s accident database (2016, Journal of Cleaner Production) gives about 0.01, as Our World in Data tabulated it in 2020.
Hydropower’s 1.30 comes almost entirely from the failure of the Banqiao dam in China in 1975. Our World in Data counts that failure as about 171,000 deaths, most of them later deaths from epidemics and famine rather than drowning. Without Banqiao, hydropower falls to about 0.04.
Chernobyl’s counted deaths and the projections
Chernobyl’s reactor was an RBMK-1000, a Soviet design whose Russian initials stand for high-power channel reactor. It had flaws most Western reactors lack: its nuclear reaction sped up when its cooling water turned to steam, and it had no Western-style containment. Early on 26 April 1986, during a turbine test, too many control rods had been removed and automatic shutdown systems disabled. An attempt to shut the reactor down then set off a power surge, and steam explosions destroyed it.
The Chernobyl Forum was eight United Nations agencies with the governments of Belarus, Russia and Ukraine. In 2005 it put the deaths directly attributed to radiation at fewer than 50, almost all among highly exposed rescue workers. Two workers were killed on the night of the accident, from injuries unrelated to radiation. Of 134 emergency workers and staff with acute radiation syndrome, 28 died in 1986. Another 19 died by 2006, usually of causes not associated with radiation, the United Nations Scientific Committee on the Effects of Atomic Radiation (UNSCEAR) reported.
Chernobyl’s counted toll also includes thyroid cancer in people exposed as children or adolescents, many through milk contaminated with radioactive iodine. Between 1991 and 2015, almost 20,000 thyroid cancers were registered in Belarus, Ukraine and the four most contaminated Russian regions among people who were under 18 in 1986. UNSCEAR estimated in 2018 that radiation caused about a quarter of the cases among those not evacuated, with an uncertainty range of at least 7 to 50 per cent. By 2005, 15 had proved fatal. Judging from experience in Belarus, the Chernobyl Forum put survival at almost 99 per cent.
How to read it: Chernobyl deaths on a logarithmic scale. The green bar is an upper bound on the deaths recorded by 2005; the red bars are projections of eventual cancer deaths. Sources: Chernobyl Forum, World Health Organization (WHO), Cardis et al., The Other Report on Chernobyl (TORCH), Greenpeace.
| Estimate | Deaths | Kind |
|---|---|---|
| Recorded by 2005: under 50 radiation deaths plus 15 thyroid cancer deaths | 64 at most | Count |
| Chernobyl Forum, 2005: the 600,000 most exposed | Up to 4,000 | Projection |
| WHO, 2006: adds five million less exposed people | Up to 9,000 | Projection |
| Cardis et al., 2006: all of Europe, to 2065 | About 16,000 | Projection |
| TORCH, 2006: top of its range | Up to 60,000 | Projection |
| Greenpeace, 2006 | About 93,000 | Projection |
The Chernobyl Forum projected that up to 4,000 people could eventually die of radiation-induced cancer among the roughly 600,000 most exposed. A WHO report the following year added up to 5,000 more, among five million people in less contaminated areas. That gave up to 9,000 in all. The International Agency for Research on Cancer projected about 16,000 cancer deaths across Europe by 2065, in a peer-reviewed study by Cardis and colleagues (2006, International Journal of Cancer). The study’s 95 per cent range runs from 6,700 to 38,000.
The two largest figures on the chart come from a report commissioned by a German Green member of the European Parliament and from Greenpeace. The TORCH report, by Ian Fairlie and David Sumner, gave 30,000 to 60,000. Greenpeace gave about 93,000, from another researcher’s estimate built on Belarus’s official health statistics.
The projections differ in how many lightly exposed people they include and in the risk per dose they assume. Radiation doses are measured in sieverts, a unit that reflects the damage radiation does to living tissue. A collective dose adds up the doses of everyone exposed, in person-sieverts.
TORCH’s method multiplies a collective dose by a risk of about 5 to 10 fatal cancers per 100 person-sieverts. That risk is taken from people such as the atomic bomb survivors, who received much higher doses. TORCH starts from 600,000 person-sieverts. At the lower risk that gives 30,000 deaths, and at the higher 60,000.
Higher risks per dose give higher tolls. In a 1990 book, the Berkeley chemist and radiation researcher John Gofman projected about 475,000 fatal cancers, assuming a risk of about 37 per 100 person-sieverts. Greenpeace’s report lists others higher still. A toll of 475,000 would put nuclear’s rate at about 5 deaths per terawatt-hour, above gas.
The central dispute
The linear no-threshold model assumes that cancer risk falls in a straight line with dose and never reaches a level too small to matter. On that model, a tiny dose spread across millions of people still produces deaths. Radiation protection assumes the model, UNSCEAR notes, though it calls the model unproven. But UNSCEAR does not recommend multiplying very low doses, at or below natural background levels, by large numbers of people to estimate how many are harmed. Its reasons are the uncertainty about risk at low doses, the lack of any biological marker of radiation harm, and studies too small to detect it.
Critics, among them Ian Fairlie, reply that uncertainty exists in practically every epidemiological study and is no reason to leave out estimates for whole populations.
In the general population UNSCEAR has found no persuasive evidence of any radiation effect beyond thyroid cancer. There are indications, though, of more leukaemia and cataracts among recovery workers who received higher doses. An effect can exist without being detected: the linear no-threshold model predicts an excess too small to see against the normal variation in cancer rates.
Greenpeace’s report also cites an estimate of 200,000 extra deaths from all causes in Belarus, Russia and Ukraine between 1990 and 2004. It comes from a 2006 Russian study of health statistics. In a 2009 book, Alexey Yablokov of the Russian Academy of Sciences describes the study as comparing death rates in contaminated provinces with those in less contaminated ones. Applying its rate, and assumed fractions of it, to people across Europe and the world, he reached 985,000 extra deaths from April 1986 to the end of 2004.
A toll of 200,000 would put nuclear’s rate at about 2 deaths per terawatt-hour, still below gas. One of 985,000 would put it at about 10, above gas but still well below coal. UNSCEAR, however, regards comparisons between areas as weaker evidence than studies of individual people. It also notes that death rates rose in most of the former Soviet Union in recent decades, which studies of the accident must take into account.
Download this conclusion: Chernobyl’s toll
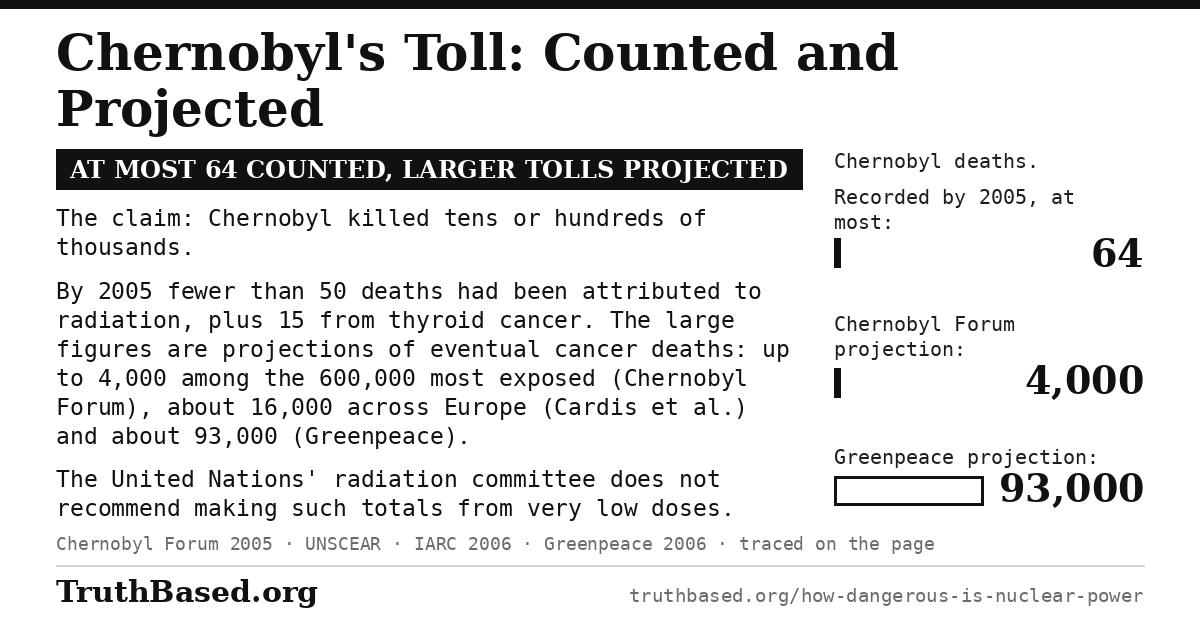
This card takes apart the claim that Chernobyl killed tens or hundreds of thousands. By 2005 fewer than 50 deaths had been attributed to radiation, plus 15 from thyroid cancer. The large figures it shows, from 4,000 to about 93,000, are projections of eventual cancer deaths. Anyone may download it and post it.
Radiation and the evacuation at Fukushima
On 11 March 2011 a magnitude 9.0 earthquake and the tsunami that followed killed 15,901 people in eastern Japan, by the National Police Agency’s count in March 2026. Another 2,519 are still missing. The tsunami disabled the power supply and cooling of three reactors at the Fukushima Daiichi plant. All three cores largely melted within three days.
How to read it: deaths linked to the March 2011 disaster, on a logarithmic scale starting at half a death so that the single radiation death shows. Sources: Japan’s labour ministry, Reconstruction Agency and police.
| Deaths | Number |
|---|---|
| Radiation death officially recognised (a plant worker, 2018) | 1 |
| Disaster-related deaths, Fukushima prefecture, to the end of 2025 | 2,350 |
| Killed by the earthquake and tsunami, police count, March 2026 | 15,901 |
No member of the public has died of radiation from Fukushima, and no case of acute radiation sickness occurred. One death has been officially recognised as caused by radiation: in September 2018 Japan’s labour ministry granted workers’ compensation for a man in his fifties. He had measured radiation at the plant after the accident and later died of lung cancer. The ministry put his exposure at about 195 millisieverts, thousandths of a sievert, from radiation work at several plants, about 74 of them after the accident. It was a compensation decision, not a clinical finding.
The United Nations Scientific Committee on the Effects of Atomic Radiation (UNSCEAR) published its 2020 report in 2021. It concluded that no adverse health effects among Fukushima residents have been documented that could be directly attributed to radiation. It also judged that future health effects from radiation are unlikely to be discernible. Fukushima prefecture’s health survey estimated external doses in the first four months for 421,394 residents. Of these, 62 per cent received less than 1 millisievert. UNSCEAR puts the worldwide average dose from natural sources at 3.0 millisieverts a year.
Japan’s Reconstruction Agency counted 2,350 disaster-related deaths in Fukushima prefecture by the end of 2025. These are deaths from the strain of the disaster and of evacuation, not from the earthquake, the tsunami or radiation. Not all can be separated from the earthquake and tsunami. But the agency’s 2012 review found more such deaths in Fukushima prefecture than in any other, and put that down largely to the evacuation.
That review examined 734 Fukushima deaths. About nine in ten were of people aged 70 or over. Seven in ten came within three months. The main causes were exhaustion from shelter life and from moving, and delayed treatment when hospitals stopped working.
Critics question whether so large an evacuation was needed, since it contributed to thousands of early deaths and radiation has been linked to one. UNSCEAR, however, estimated that the evacuation cut first-year doses in the evacuated areas by up to a factor of ten.
By June 2021, ultrasound screening had found 263 malignant or suspected thyroid cancers, far more than expected. It covered those aged 18 or under at the time, about 368,000 people, and later those born in the following year.
UNSCEAR attributes the excess to the screening, which finds many cancers that may never have caused symptoms. It points out that, unlike after Chernobyl, no excess appeared in children exposed before the age of five. It also notes that the cancers appeared within one to three years, rather than from four to five years as after Chernobyl and in other radiation studies.
Some researchers, among them Tsuda et al. (2016, Epidemiology), argue that the excess is unlikely to be explained by screening.
About 22,400 people from Fukushima prefecture were still evacuated in August 2026, down from about 160,000 in May 2012. By July 2020 only about 30 per cent of former residents had returned to the twelve evacuated municipalities, in Japan’s Board of Audit’s figures.
Download this conclusion: Fukushima’s deaths
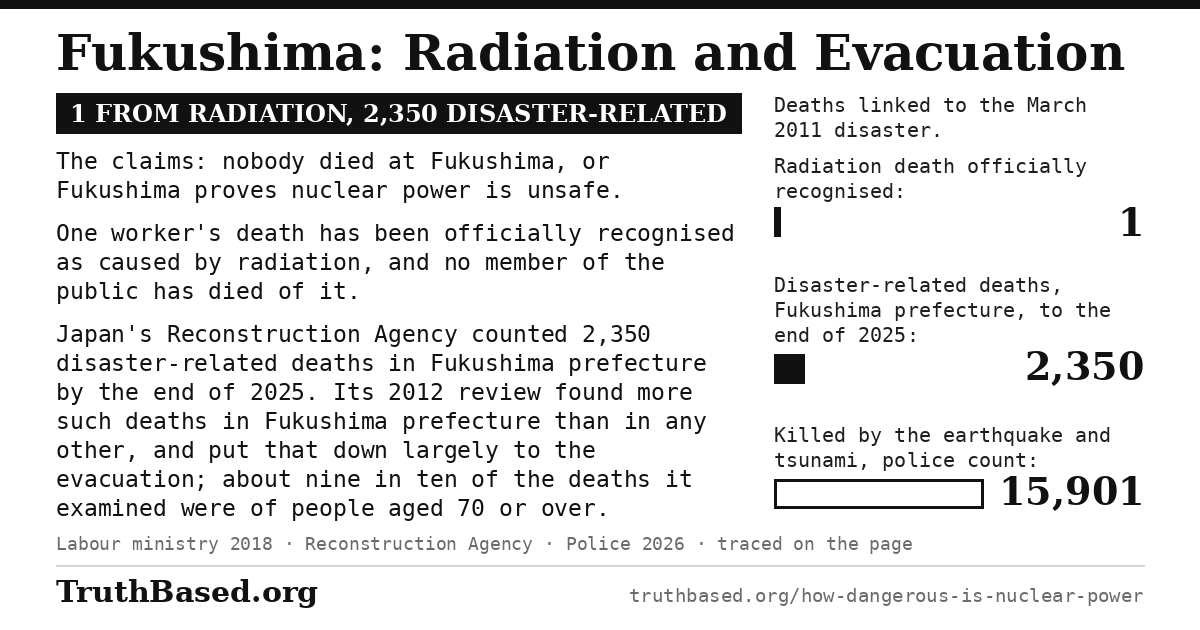
This card takes apart two opposite claims, that nobody died at Fukushima and that it proves nuclear power is unsafe. One worker’s death is officially recognised as caused by radiation. Separately, 2,350 disaster-related deaths, mostly linked to the evacuation, were certified in Fukushima prefecture by the end of 2025. Anyone may download it and post it.
Three Mile Island, and the accidents that were not civilian power
At Three Mile Island in 1979 at least 45 per cent of the core of Unit 2 melted, and the containment building held. The US Nuclear Regulatory Commission (NRC) reports an estimated average dose of about 0.01 millisieverts to the roughly two million people around the plant. That compares with a natural background there of about 1 to 1.25 millisieverts a year.
No radiation death from the accident has been confirmed. A University of Pittsburgh follow-up of 32,135 people living within five miles found no consistent evidence that the release affected cancer deaths to 1998. Some cancers were raised in the higher exposure groups, though. And a 1997 reanalysis of cancer incidence near the plant, by Wing and colleagues, found lung cancer and leukaemia rising with estimated dose.
Three other fatal accidents are sometimes set against nuclear power, though none happened at a civilian power plant.
| Event | What it actually was | Deaths |
|---|---|---|
| Kyshtym, USSR, 1957 | Explosion of a high-level radioactive waste tank at Mayak, which extracted plutonium for weapons | About 200, by an estimate Our World in Data reports |
| Windscale, UK, 1957 | Fire in a pile producing plutonium for military use, not a power reactor | No immediate harm to health; about 100 eventual cancer deaths, by a 1990 estimate |
| SL-1, USA, 1961 | Prototype military reactor | 3 operators killed by a steam explosion |
The 1999 accident at Tokaimura in Japan, which killed two workers, did not happen at a civilian power plant either: it was at a plant preparing fuel for experimental reactors. In the history of civilian nuclear electricity, Chernobyl is the only accident with a substantial confirmed radiation death toll.
The waste
Reactors worldwide had discharged about 448,000 tonnes of spent fuel by June 2026, by the International Atomic Energy Agency’s count as the American Nuclear Society reported it. The United States holds about 90,000 tonnes, at more than 70 sites. Those sites are in 35 states, and the Department of Energy says all of that fuel would fit on a single football field less than 10 yards deep. A small volume of intensely radioactive material is a different problem from a large volume of a mild one, not automatically an easier one.
Spent fuel is held first in cooling pools and then in dry casks, sealed steel cylinders inside concrete or steel shielding. The first American dry casks were loaded in 1986. Since then, the US Nuclear Regulatory Commission (NRC) states, dry storage has released no radiation that affected the public or contaminated the environment. That record is short against the timescales involved, though, and the NRC has studied canister ageing.
Finland is closest to permanent disposal. Posiva’s Onkalo repository at Olkiluoto places spent fuel in iron and copper canisters packed in bentonite clay about 430 metres down in the bedrock. In August 2026 Finland’s Radiation and Nuclear Safety Authority found that the repository meets the safety requirements for an operating licence. Posiva aims to be ready to begin disposal by the end of 2026. Onkalo would be the first deep geological repository for spent fuel in operation anywhere.
In the United States, Congress designated Yucca Mountain for a repository in 1987, and the Department of Energy moved to withdraw its licence application in 2010. The NRC finished its safety evaluation in January 2015. It found that the application met its requirements, which run to a million years, apart from land and water rights the department had not obtained. No waste was ever emplaced. In July 2026 the department turned instead to five states that had offered to explore hosting nuclear waste, the Las Vegas Sun reported.
The strongest case that disposal is not solved
Civilian nuclear power is about seventy years old and no repository for spent fuel is yet operating. Canister corrosion over long periods is contested, including a documented scientific dispute in Sweden over copper corrosion in oxygen-free water. Demonstrating safety over more than 100,000 years, including warning future societies away from the site, is not a normal engineering test. And the American case shows that political consent can override technical adequacy.
Short-lived fission products such as caesium-137 dominate the hazard for about the first hundred years. After that, long-lived actinides, mainly plutonium and americium, control a long tail. Spent fuel disposed of directly falls to the radiotoxicity of the uranium ore it came from only after more than 100,000 years, by the Nuclear Energy Agency’s reckoning. The 10,000-year figure often quoted was a regulatory compliance period, not the point at which the material becomes harmless.
The strongest case against nuclear power
Cost and time explain why so little nuclear power is being built in Western countries, even if it is as safe as the mortality data suggest. The four Western projects in the chart ran years late and cost roughly two to seven times their first budgets. Westinghouse, the reactor supplier for Vogtle in the United States, filed for bankruptcy protection in 2017.
How to read it: each project’s first budget against its final or latest cost, in billions of its own currency, so compare the pair, not the projects with each other.
| Project | First budget | Final or latest cost | Delay |
|---|---|---|---|
| Vogtle 3 and 4, United States | 14 billion dollars | More than 35 billion dollars, all owners’ spending (Atlanta Journal-Constitution) | About seven years |
| Hinkley Point C, Britain | 18 billion pounds, 2015 prices | About 35 billion pounds, 2015 prices (EDF, July 2026) | First unit due 2030, against 2025 |
| Flamanville 3, France | 3.3 billion euros, construction only, in 2006 | 23.7 billion euros, 2023 prices, financing included (Cour des comptes, France’s audit office) | Twelve years |
| Olkiluoto 3, Finland | 3.2 billion euros, in 2003 | About 11 billion euros (2025 study in the journal Energy) | Thirteen years |
The 2026 analysis by Lazard, a financial advisory and asset management firm, compares the lifetime cost of electricity from new plants, without subsidies. It puts new nuclear at 175 to 255 dollars per megawatt-hour, against 37 to 99 for onshore wind. Large solar farms come to 40 to 98, and combined-cycle gas to 51 to 129. Running an existing, fully depreciated American nuclear plant costs 26 to 36 dollars, which is why keeping old reactors open is a very different proposition from building new ones.
Because nuclear’s cost is largely paid upfront, it depends heavily on the cost of borrowing. The Nuclear Energy Agency and the International Energy Agency published a costing study in 2020. It put a new French reactor at 45 dollars per megawatt-hour at a 3 per cent discount rate. At 10 per cent, the same reactor came to 97.
Against that, the wind and solar figures leave out the cost of covering periods without wind or sun. Lazard estimates that cost under the rules of six American grid operators. It brings wind and solar, with or without batteries, to 87 to 167 dollars, still below new nuclear. But its method does not price a supply that runs around the clock.
The 2020 costing study also found that nuclear construction is not inherently slow or expensive. It put the overnight cost of a new plant, the cost before any interest, at about 2,157 dollars per kilowatt in South Korea and 2,500 in China. In the United States it was 4,250. Whether Western countries can build at Korean costs is not settled.
Comparing 349 reactors in seven countries, Lovering, Yip and Nordhaus (2016, Energy Policy) suggest that nuclear technology has no inherent trend of rising costs. France built most of its fleet quickly in the 1970s and 1980s. Grubler (2010, Energy Policy) found that centralised decision-making, standardisation and stable regulation were key to that speed, though even there real construction costs rose substantially.
Critics such as Amory Lovins add that nuclear power is slow. Each dollar spent on a new reactor, he argues, buys about two to ten times less carbon saving than cheaper alternatives, and buys it twenty to forty times more slowly. A 2019 report by the International Energy Agency, though, found that in advanced economies, replacing reactors with renewables would cost more than extending the reactors’ lives.
Civilian programmes have also fed weapons programmes. India’s 1974 test probably used plutonium from a research reactor built with Canada, whose heavy water the United States had supplied for peaceful use. North Korea built its plutonium weapons around its Yongbyon complex. A network run by Abdul Qadeer Khan, often called the father of Pakistan’s nuclear weapons programme, supplied uranium-enrichment technology to Iran, Libya and North Korea.
The International Atomic Energy Agency’s safeguards check, through inspections and nuclear accounting, that peaceful nuclear material is not diverted to weapons. They were strengthened after Iraq’s secret programme was discovered. The Additional Protocol of 1997, which countries may add to their safeguards agreements with the agency, aims to detect cheating much earlier. But detection is not prevention. This cost is not measured in deaths per terawatt-hour.
What Germany’s phase-out cost
Replacing nuclear generation with coal raised air pollution deaths in Germany by about 330 to 800 a year from 2012 to 2019, by a peer-reviewed estimate. The range depends on the method.
Germany accelerated its nuclear exit after Fukushima, closing eight reactors in 2011 and the last three on 15 April 2023. Coal’s share of German electricity rose from 24.8 per cent in 2020 to 33.2 per cent in 2022. The federal statistics office says coal helped make up for sharp falls in power from nuclear and gas, whose price rose sharply after Russia invaded Ukraine.
Jarvis, Deschenes and Jha’s 2019 working paper put the cost of the phase-out at about 12 billion dollars a year. More than 70 per cent of that came from about 1,100 extra deaths a year caused by air pollution. Their peer-reviewed version appeared in the Journal of the European Economic Association in 2022. It lowered the cost to 3 to 8 billion euros a year. It also lowered the extra deaths to 330 to 800 a year, with 800 as the authors’ preferred figure.
A separate 2025 study estimated roughly 170 extra deaths a year before the age of 75 from non-infectious respiratory diseases alone. Another, in the journal PLOS One, found that the phase-out’s extra yearly carbon dioxide emissions had disappeared by 2023 as renewables grew.
The verdict: what the evidence shows
Far less dangerous than fossil fuels. Per unit of electricity, nuclear power is among the safest sources, level with wind and solar in Our World in Data’s figures and hundreds of times safer than coal. The fossil fuel deaths come from the air pollution of normal operation, while nuclear’s come from two accidents. Even Greenpeace’s projection of Chernobyl’s toll would leave nuclear below gas; John Gofman’s, which assumes several times the risk per dose that other projections use, would not. And at Fukushima all but one of the deaths came from the disaster and the evacuation, not from radiation.
What counts against nuclear power is mainly its cost and building time, with permanent waste disposal and the spread of weapons still unsettled.
Five common claims, against the evidence
Claim“Nuclear power is among the most dangerous energy sources.”
Not supportedAbout 0.03 deaths per terawatt-hour in Our World in Data’s figures, level with wind and solar and about 800 times below coal. Greenpeace’s Chernobyl projection would raise it to about 1, still below gas at 2.82.
Claim“Chernobyl killed tens or hundreds of thousands.”
Not a countFewer than 50 deaths were attributed to radiation by 2005, plus 15 from thyroid cancer. The 4,000 to 93,000 figures are projections of eventual cancer deaths.
Claim“Fukushima proves nuclear power is unsafe.”
Not as statedNo member of the public died of radiation, and one worker’s death is officially recognised. But 2,350 disaster-related deaths were certified in Fukushima prefecture by the end of 2025, mostly linked to the evacuation.
Claim“Nuclear waste has never harmed anyone.”
True of US dry storage so farUS dry cask storage has released no radiation that affected the public since 1986, the US Nuclear Regulatory Commission says. No repository is yet operating, and the waste stays hazardous for more than 100,000 years.
Claim“New nuclear is the cheapest way to cut emissions.”
Not in Western marketsThe 2026 analysis by the financial firm Lazard puts new nuclear at 175 to 255 dollars per megawatt-hour against 37 to 99 for onshore wind. Four recent Western projects cost roughly two to seven times their first budgets.
Download the conclusion
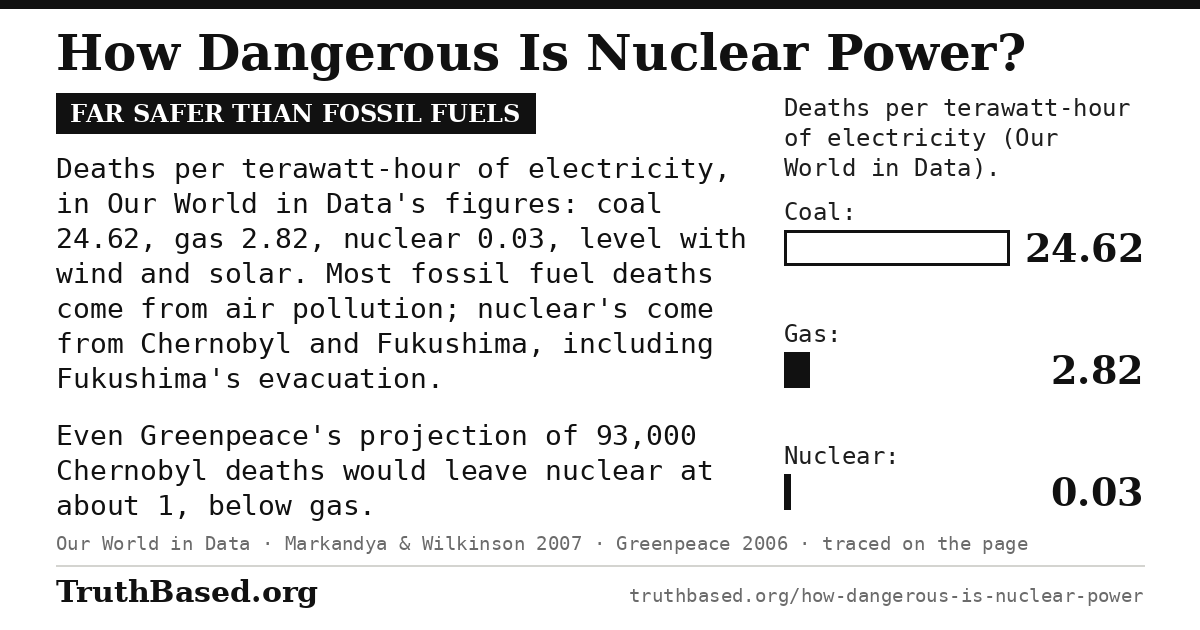
The verdict above as one image, with the three numbers that frame it. They are deaths per terawatt-hour of electricity in Our World in Data’s figures: 24.62 for coal, 2.82 for gas and 0.03 for nuclear. Anyone may download it and post it.
What would change this conclusion
The answer would change with:
• A full-lifecycle death rate for nuclear power, from Our World in Data or a peer-reviewed study, above gas at 2.82 deaths per terawatt-hour.
• Cohort studies by the World Health Organization or the United Nations’ radiation committee that detect, rather than project, tens of thousands of excess cancer deaths from Chernobyl or Fukushima.
• A release from spent fuel storage or a repository that harms the public, reported by the US Nuclear Regulatory Commission or another regulator.
• Severe accidents at modern reactors every few years rather than once in decades, reported by national regulators.
• New Western reactors built at the overnight costs, before any interest, that the 2020 costing study by the Nuclear Energy Agency and the International Energy Agency expects for South Korea.
Sources
Our World in Data. What are the safest and cleanest sources of energy? Hannah Ritchie, with its chart and data file of deaths per terawatt-hour. Source for every rate in chart 1 and its table, the 1965 to 2021 basis of the nuclear and hydropower rates, the 433 Chernobyl and 2,314 Fukushima deaths in the nuclear rate, Banqiao’s 171,000, the estimate of about 200 deaths at Kyshtym and SL-1’s description as a prototype military reactor. ourworldindata.org ourworldindata.org
Our World in Data. What was the death toll from Chernobyl and Fukushima? Source for how the 433 and the 2,314 were reached, and for the questions raised about the evacuation’s scale. ourworldindata.org
Markandya A, Wilkinson P. Electricity generation and health. The Lancet 2007;370(9591):979–990. Source for the fossil fuel and biomass rates, that they are mostly air pollution deaths at European plants with modern controls, coal’s accident share, and the 0.074 for nuclear. thelancet.com
Sovacool BK et al. Balancing safety with sustainability: assessing the risk of accidents for modern low-carbon energy systems. Journal of Cleaner Production 2016;112:3952–3965. Source for the wind and solar rates and the accident-only rate of about 0.01 for nuclear, as Our World in Data tabulated them in 2020; a copy of its table is kept at Wikimedia Commons. sciencedirect.com commons.wikimedia.org
Encyclopædia Britannica. Typhoon Nina–Banqiao dam failure. Source for the split of the Banqiao toll between people who drowned and later deaths from epidemics and famine. britannica.com
World Nuclear Association. Chernobyl Accident 1986; RBMK Reactors. Source for what the RBMK’s initials stand for, the reactor’s flaws, the missing Western-style containment and the sequence of the test. world-nuclear.org world-nuclear.org
The Chernobyl Forum. Chernobyl’s Legacy: Health, Environmental and Socio-Economic Impacts. IAEA, second revised version, 2006; and the joint press release of 5 September 2005. Source for the Forum’s membership, fewer than 50 deaths attributed to radiation, the survival rate and the projection of up to 4,000 among 600,000. iaea.org unis.unvienna.org
UNSCEAR. Sources and Effects of Ionizing Radiation, 2008 Report, Annex D: Health effects due to radiation from the Chernobyl accident. Source for the 134 workers with acute radiation syndrome, the 28 deaths in 1986, the 19 later deaths, the 15 thyroid cancer deaths by 2005, the indications of more leukaemia and cataracts among recovery workers, the explosions that destroyed the reactor, the finding of no persuasive evidence of other effects in the general population, and the weaker evidence of comparisons between areas (paragraph D76). unscear.org
UNSCEAR. Evaluation of data on thyroid cancer in regions affected by the Chernobyl accident. White paper, 2018. Source for the almost 20,000 thyroid cancers registered from 1991 to 2015 and the share of about a quarter, with an uncertainty range of at least 7 to 50 per cent, caused by radiation. unscear.org
WHO. Health effects of the Chernobyl accident: an overview. April 2006. Source for up to 5,000 more deaths among five million people in less contaminated areas. who.int
International Agency for Research on Cancer. Briefing document: the cancer burden from Chernobyl in Europe. April 2006; on Cardis E et al., International Journal of Cancer 2006;119:1224–1235. Source for about 16,000 deaths across Europe by 2065 and the range of 6,700 to 38,000. iarc.who.int. Source for the journal’s peer review: the Union for International Cancer Control, which founded it, in an announcement of 15 January 2026 on the journal’s 60 years uicc.org
Fairlie I, Sumner D. TORCH: The Other Report on Chernobyl. April 2006. Source for 30,000 to 60,000 deaths, its commissioning, and the arithmetic from 600,000 person-sieverts. nirs.org
US Nuclear Regulatory Commission. Glossary, full text: sievert, dose equivalent, collective dose and millirem. Source for what a sievert, a millisievert and a collective dose are. nrc.gov
Greenpeace. The Chernobyl Catastrophe: Consequences on Human Health. 2006. Source for about 93,000 deaths, its basis in an estimate built on Belarus’s health statistics, the higher projections it lists, and the 200,000 extra deaths from all causes it cites, with the 2006 Russian study it takes them from (pages 9 and 31, and its table 1.2.2). sortirdunucleaire.org
Gofman JW. Radiation-Induced Cancer from Low-Dose Exposure: An Independent Analysis. Committee for Nuclear Responsibility, 1990, chapter 24. Source for the projection of about 475,000 fatal cancers and the risk of about 37 per 100 person-sieverts behind it. ratical.org. Source for who Gofman was: University of California, Berkeley, press release, John Gofman, anti-nuclear activist & lipid researcher, has died, 4 September 2007 berkeley.edu
UNSCEAR. 2012 Report, Annex A: Attributing health effects to ionizing radiation exposure and inferring risks. Source for UNSCEAR’s position on multiplying very low doses by large numbers of people, its reasons, its account of the model as assumed for radiation protection but unproven, and why no single cancer can be attributed to radiation with certainty. unscear.org
Fairlie I. UNSCEAR attempt to limit collective dose assessments from Fukushima’s fallout. 25 February 2013. Source for the critics’ reply. ianfairlie.org
Yablokov AV, Nesterenko VB, Nesterenko AV. Chernobyl: Consequences of the Catastrophe for People and the Environment. Annals of the New York Academy of Sciences, volume 1181, 2009; chapter 7, Mortality after the Chernobyl catastrophe, by Yablokov, pages 192 to 216. Source for the 985,000 extra deaths from April 1986 to the end of 2004 and how they were reached (page 210), the 2006 Russian study’s comparison of death rates (pages 207 to 210), and Yablokov’s affiliation. pubmed.ncbi.nlm.nih.gov
UNSCEAR. Chernobyl, on its areas-of-work pages. Source for the rise in death rates in most of the former Soviet Union in recent decades, which studies of the accident must take into account. unscear.org
National Police Agency of Japan. Damage and police measures for the 2011 Tohoku earthquake, 9 March 2026 (in Japanese). Source for the 15,901 dead and 2,519 missing. npa.go.jp
World Nuclear Association. Fukushima Daiichi Accident. Source for the loss of power and cooling and the three melted cores. world-nuclear.org
Japan’s Ministry of Health, Labour and Welfare. Release on the compensation decision, 4 September 2018 (in Japanese); and Time, Japan Acknowledges the First Radiation-Linked Death From the Fukushima Nuclear Disaster, 6 September 2018. Source for the labour ministry’s compensation decision, the worker’s work and illness, and his exposure of about 195 millisieverts, about 74 of them after the accident. mhlw.go.jp time.com
UNSCEAR. 2020/2021 Report, Volume II, Annex B; its press release of 9 March 2021; and its frequently asked questions. Source for the finding of no documented health effects attributable to radiation among residents, the judgement on future effects, and the reasons UNSCEAR gives for the thyroid excess. unscear.org unscear.org unscear.org
Ishikawa T et al. The Fukushima Health Management Survey: estimation of external doses to residents in Fukushima Prefecture. Scientific Reports 2015. Source for the 421,394 residents and the 62 per cent under 1 millisievert. pmc.ncbi.nlm.nih.gov
UNSCEAR. 2013 Report, Volume I, Annex A. Source for the absence of radiation deaths and acute radiation sickness, and for the doses the evacuation averted. unscear.org
UNSCEAR. 2024 Report, Volume II, Annex B: Evaluation of public exposure to ionizing radiation. 2025. Source for the worldwide average dose from natural sources of 3.0 millisieverts a year. unscear.org
Reconstruction Agency of Japan. Disaster-related deaths of the Great East Japan Earthquake, as of 31 December 2025, 13 February 2026; and report on disaster-related deaths, 21 August 2012 (both in Japanese). Source for the 2,350 deaths in Fukushima prefecture, their definition, and the 2012 review’s findings on age, timing and causes. reconstruction.go.jp reconstruction.go.jp
Shimura H et al. A comprehensive review of the progress and evaluation of the thyroid ultrasound examination program, the Fukushima Health Management Survey. Journal of Epidemiology 2022. Source for the 368,000 people aged 18 or under at the time, the later addition of those born in the following year, and the 263 malignant or suspected cancers by June 2021. pmc.ncbi.nlm.nih.gov
Tsuda T et al. Thyroid cancer detection by ultrasound among residents ages 18 years and younger in Fukushima, Japan: 2011 to 2014. Epidemiology 2016;27(3):316–322. Source for the view that the excess is unlikely to be explained by screening. pubmed.ncbi.nlm.nih.gov
Fukushima Prefecture. Transition of the number of evacuees; and damage report No. 1805, 14 September 2026 (in Japanese). Source for the 160,000 evacuated in May 2012 and the 22,373 still evacuated on 1 August 2026. pref.fukushima.lg.jp pref.fukushima.lg.jp
Board of Audit of Japan. Report on the implementation of projects for recovery from the Great East Japan Earthquake, February 2023 (in Japanese). Source for the share of former residents who had returned to the twelve municipalities by 1 July 2020: the rows of its table 3-5-3 (page 80) sum to 44,028 returnees against 147,443 people registered on 11 March 2011, about 30 per cent, as Evrard O et al., SOIL 2023;9:479–497, also find. report.jbaudit.go.jp
US Nuclear Regulatory Commission. Backgrounder on the Three Mile Island Accident; and World Nuclear Association, Three Mile Island Accident. Source for the core damage, the average dose of about 0.01 millisieverts and the local background of 1 to 1.25. nrc.gov world-nuclear.org
Talbott EO et al. Long-term follow-up of the residents of the Three Mile Island accident area: 1979–1998. Environmental Health Perspectives 2003;111(3):341–348. Source for the 32,135 residents and the study’s findings. pubmed.ncbi.nlm.nih.gov
Wing S et al. A reevaluation of cancer incidence near the Three Mile Island nuclear plant. Environmental Health Perspectives 1997;105(1):52–57. Source for the reanalysis finding lung cancer and leukaemia rising with dose. pmc.ncbi.nlm.nih.gov
Wakeford R. The Windscale reactor accident: 50 years on. Journal of Radiological Protection 2007; and The nuclear accidents of 1957, 2017. Source for what Kyshtym and Windscale were, and for Windscale’s health effects. iopscience.iop.org iopscience.iop.org
Atomic Heritage Foundation. Idaho Falls; World Nuclear Association, Tokaimura Criticality Accident 1999. Source for the SL-1 accident and its three deaths, and for the Tokaimura accident. ahf.nuclearmuseum.org world-nuclear.org
American Nuclear Society. IAEA releases interactive tool on global spent nuclear fuel. 25 June 2026. Source for the 448,000 tonnes discharged worldwide, the IAEA’s count as the society reported it. ans.org
US Department of Energy. 5 Fast Facts about Spent Nuclear Fuel. Source for the 90,000 tonnes at more than 70 sites in 35 states and the football field. energy.gov
US Nuclear Regulatory Commission. Backgrounder on Dry Cask Storage of Spent Nuclear Fuel; Dry Cask Storage; and NUREG-2214 on ageing of storage systems. Source for how spent fuel is stored, the record since 1986 and the study of canister ageing. nrc.gov nrc.gov nrc.gov
STUK. The Radiation and Nuclear Safety Authority supports the licence for a spent nuclear fuel final disposal facility. 4 August 2026; and Posiva’s release of the same day. Source for Onkalo’s design and depth, STUK’s finding and Posiva’s aim. stuk.fi posiva.fi
US Nuclear Regulatory Commission. Backgrounder on Licensing Yucca Mountain; and Congressional Research Service, R44151. Source for the 1987 designation, the 2010 withdrawal, the 2015 safety evaluation and the million-year standard. nrc.gov everycrsreport.com
Las Vegas Sun. Nevada officials celebrate shift of American nuclear waste strategy away from Yucca Mountain. 30 July 2026. Source for the department’s turn to five volunteer states. lasvegassun.com
Swedish Radiation Safety Authority. Technical Note 2019:22, external experts’ reviews of SKB’s report on canister integrity. Source for the dispute over copper corrosion in oxygen-free water. stralsakerhetsmyndigheten.se
OECD Nuclear Energy Agency. Physics and Safety of Transmutation Systems: A Status Report. NEA No. 6090, 2006. Source for how the hazard changes over time and the more than 100,000 years to reach the radiotoxicity of uranium ore. oecd-nea.org
US Energy Information Administration. Plant Vogtle Unit 4 begins commercial operation. 1 May 2024; Atlanta Journal-Constitution, 19 December 2023; World Nuclear News, Westinghouse emerges from Chapter 11, 2 August 2018. Source for Vogtle’s first budget and dates, the more than 35 billion dollars spent, and the bankruptcy filing. eia.gov ajc.com world-nuclear-news.org
New Civil Engineer. Hinkley Point C’s cost climbs to £35bn with confirmation Unit 1 will power up in 2030. 20 February 2026; and EDF, Half-year financial report at 30 June 2026. Source for Hinkley Point C’s first budget of 18 billion pounds and first target of 2025, and for EDF’s latest estimate, about 35 billion pounds with the first unit in 2030. newcivilengineer.com edf.fr
Cour des comptes. La filière EPR : une dynamique nouvelle, des risques persistants. January 2025 (in French); and ICI (Radio France), 14 January 2025. Source for Flamanville 3’s first construction budget of 3.3 billion euros, estimated in 2006, its total of 23.7 billion euros and its twelve-year delay. vie-publique.fr ici.fr
World Nuclear Association. Nuclear Power in Finland; and Satymov R et al. Who will foot the bill? Energy 2025;337:138630. Source for Olkiluoto 3’s 3.2 billion euro contract of 2003, its final cost of about 11 billion and its thirteen-year delay. world-nuclear.org powerlab.fsb.hr
Lazard. Levelized Cost of Energy+ (LCOE+), Version 19.0. July 2026. Source for the unsubsidised costs of new nuclear, wind, solar and gas, the cost of running existing nuclear, and the firming estimate. lazard.com. Source for what Lazard is: Lazard, Inc., annual report on Form 10-K for 2025, Item 1 sec.gov
IEA and OECD Nuclear Energy Agency. Projected Costs of Generating Electricity, 2020 edition. Source for the French reactor’s cost at 3 and 10 per cent, the finding that nuclear construction is not inherently slow or expensive, and the overnight costs in South Korea, China and the United States. iea.blob.core.windows.net
Grubler A. The costs of the French nuclear scale-up: a case of negative learning by doing. Energy Policy 2010;38(9):5174–5188; and his IIASA Interim Report IR-09-036, An assessment of the costs of the French nuclear PWR program 1970–2000, 2009. Source for what made France’s build fast, its rising costs, and how much of the fleet was built when. pure.iiasa.ac.at pure.iiasa.ac.at
Lovering JR, Yip A, Nordhaus T. Historical construction costs of global nuclear power reactors. Energy Policy 2016;91:371–382. Source for the 349 reactors in seven countries and the authors’ suggestion that nuclear technology has no inherent cost escalation trend. doi.org
PBS NOVA. Nuclear After Japan: Amory Lovins. 18 March 2011; and IEA, Nuclear Power in a Clean Energy System, May 2019. Source for Lovins’s argument and the IEA’s finding. pbs.org iea.blob.core.windows.net
US Department of State. Foreign Relations of the United States, 1969–1976, Volume E-8, Document 163; and Arms Control Association, profile of North Korea, New Details Emerge on Pakistani Networks (2005) and Looking Back: The Additional Protocol (2007). Source for the proliferation cases, what the agency’s safeguards check and how, and the Additional Protocol. history.state.gov armscontrol.org armscontrol.org armscontrol.org
World Nuclear Association. Nuclear Power in Germany; and Destatis, press releases on electricity generation in 2020, 2022 and 2023. Source for the reactor closures, coal’s share of 24.8 per cent in 2020 and 33.2 per cent in 2022 (as revised in the release of 7 March 2024), and why coal’s share rose. world-nuclear.org destatis.de destatis.de destatis.de
Jarvis S, Deschenes O, Jha A. The private and external costs of Germany’s nuclear phase-out. NBER Working Paper 26598, 2019; Journal of the European Economic Association 2022;20(3):1311–1346. Source for 12 billion dollars and about 1,100 deaths in the working paper, and 3 to 8 billion euros and 330 to 800 deaths in the published version. nber.org eprints.lse.ac.uk
Kaariaho T. Unintended effects of Germany’s nuclear phase out. Environmental and Resource Economics 2025; and Loiacono L, Rizzo L, Secomandi R. Nuclear phase-out: can we catch up on CO2 emissions? PLOS One 2025. Source for the roughly 170 deaths a year before age 75 from non-infectious respiratory diseases, and the carbon dioxide finding. doi.org doi.org
You May Also Like
TruthBased.org is reader-supported. You can contribute by card or PayPal, or with cryptocurrency, on the support page.
Cite this article
TruthBased.org. “How Dangerous Is Nuclear Power?” Updated October 2026. https://www.truthbased.org/how-dangerous-is-nuclear-power