Political Fact Checks
Is Voter Fraud a Real Problem?
1,619 cases on Heritage’s list since 1982, about 7 per 10 million federal ballots, and what 2020 found.
Crime & Justice
Which Side Commits More Political Violence?
Deaths and attacks by side in the counts of CSIS, Cato, New America and ADL, and what moves the totals.
History & Myth-Busting
Did the US Political Parties Switch?
Roll-call votes, congressional seats and the Southern Strategy in their own words, tested against what both sides claim.
Do Voter ID Laws Reduce Turnout?
The biggest study ever run on this found nothing. Several smaller ones found something. The study that started the argument was taken apart by its own data. Here is what each one can actually support.
The short answer
Not nationally. In some individual states, yes.
The largest study ever run on this followed 1.6 billion voter records across ten years and eleven states that adopted strict identification laws. It found a turnout effect of minus 0.1 points, and ruled out any reduction greater than half a point. Studies of single states point the other way: Georgia, North Carolina, Rhode Island and South Carolina each found declines, and the GAO measured drops of roughly 2 to 3 points in Kansas and Tennessee. The 10.3-point figure for Latino turnout that circulates most widely should not be quoted, because a replication in the same journal showed the survey data yield positive, negative or null estimates depending on how matching errors are handled. On the other side of the argument, in-person impersonation, the only thing polling-place identification can address, is measured at 31 credible cases against more than a billion ballots, and no study anywhere has measured whether an identification law reduced fraud.
Claim“Voter ID laws suppress turnout, especially among minorities”
EvidenceThe best-identified national study finds no aggregate effect and rules out a drop above 0.5 points. The 10.3-point Latino figure comes from survey data that a replication showed can yield positive, negative or null estimates. What does survive: in Texas, Black voters were 11.4% of those who voted with identification and 16.1% of those who had to vote without it.
Claim“Voter ID laws prevent fraud”
EvidenceNo study has ever measured whether an identification law reduced fraud; the base rate is too low for the question to be answerable. In-person impersonation runs at 31 credible cases against more than a billion ballots. The Heritage Foundation’s own database records far more mail-ballot cases than impersonation cases, and photo identification at a polling station does not touch mail ballots.
Claim“ID laws increase public confidence in elections”
EvidenceThis is the justification the Supreme Court accepted in Crawford, and it has been tested. People living under identification laws do not report greater confidence in elections, nor lower perceived rates of impersonation. Confidence tracks whether a voter’s own side won.
What this covers
This page is about whether requiring photo ID at the polls reduces how many people vote, in the United States. It covers fraud only as far as is needed to say what ID can and cannot address; the evidence on how much fraud exists is on the voter fraud page. It is not about mail ballots, registration purges, or polling-place closures.
What Is Actually Being Measured
Thirty-six states ask for some form of identification at the polls. The disagreement is not about those thirty-six. It is about a much smaller group where the law has teeth.
The National Conference of State Legislatures splits the laws on two questions, and the second one is what matters. A non-strict law lets a voter without ID cast a ballot that still counts, usually by signing an affidavit or being vouched for. A strict law does not: the voter casts a provisional ballot and must return to an election office within a few days with acceptable ID, or the ballot is discarded. Roughly a dozen states run strict laws. Those are the ones every serious study is about.
This distinction is also where a great deal of apparent disagreement between studies comes from. Different researchers group the states differently. Some merge strict photo and strict non-photo into one category. Others split them four or five ways. Two papers can study the same years, reach opposite conclusions, and both be describing their own data accurately, because they are not counting the same states.
Read every figure on this page with its design attached
The fault line running through this literature is not left against right. It is administrative records against survey self-report. Studies built on voter files, which record whether a named person actually voted, tend to find small or no aggregate effects. Studies built on surveys, which ask people whether they voted and then try to match them to a voter file, have produced the largest estimates and the fiercest methodological fights. Where a number comes from decides what it can carry.
The Largest Study Ever Run on This Found Nothing
In 2021 the Quarterly Journal of Economics published the biggest test of the question anyone has attempted. Enrico Cantoni and Vincent Pons built a panel of individual voter records covering 2008 to 2018 and compared states that adopted strict ID laws with states that did not, following the same named individuals across elections.
The dataset contains 1.6 billion observations. That is not a sample of voters. It is close to the electorate itself, tracked over a decade.
Cantoni and Pons 2021, most demanding specification
State, year and voter fixed effects · 2008–2018
Effect on overall turnout−0.1 points (95% CI −3.0 to +2.8)
Effect on overall registration−0.1 points (95% CI −2.3 to +2.1)
Non-white turnout, relative to white+1.4 points (95% CI −0.5 to +3.2)
Non-white voters contacted by a campaign+4.7 points
How to read it: each row is one quantity Cantoni and Pons measured, with the point estimate first and the range the data is consistent with in brackets. A negative number means turnout fell, a positive number means it rose. Every range in the first three rows crosses zero, which means the study cannot tell an effect apart from no effect at all. The fourth row does not cross zero.
Their own summary is that the laws have no negative effect on registration or turnout, overall or for any group defined by race, gender, age or party. Using counties that sit on either side of a state border, they go further and rule out that strict ID laws reduce turnout by more than half a percentage point.
Note the third row. The effect for non-white voters relative to white voters is positive, and its confidence interval crosses zero. On this design, the differential harm that the whole argument is about does not appear at all.
The fourth row is the most interesting thing in the paper and the authors flag it themselves. The chance of a non-white voter being contacted by a campaign rose by 4.7 points in states that passed these laws. Their suggestion is that party mobilisation may have offset whatever effect the laws had. That is not a measured offset. It is a plausible mechanism for why a null result might sit on top of a real burden, and it is the single best reason not to read this paper as the end of the matter.
What the authors say the study cannot do
They state that their results apply most directly to states that already required some form of identification, and less to states that required none. They also note that the states which adopted strict laws had different turnout levels beforehand, though not different trends, which is what their design actually depends on.
Single States Tell a Different Story
A national null does not mean nothing happened anywhere. Studies of individual states have repeatedly found declines, and any honest account has to carry them.
Work on Georgia, North Carolina, Rhode Island and South Carolina has each found turnout decreases following ID requirements. A study of Virginia found an increase. These are narrower in scope than the national panel, and a single state gives you one policy change rather than eleven, but they are not fringe results and they point in a direction the national study does not.
The Government Accountability Office ran its own comparison in 2014, setting Kansas and Tennessee, which tightened their requirements, against four states that did not. It found turnout fell further in the two treatment states between 2008 and 2012: by an estimated 1.9 to 2.2 points in Kansas and 2.2 to 3.2 points in Tennessee. The GAO also reviewed ten existing studies and found five showing no significant effect, four showing significant decreases and one showing an increase.
GAO 2014, turnout decline attributable to tightened ID rules
2008 to 2012 general elections · against four comparison states
Kansas1.9 to 2.2 points
Tennessee2.2 to 3.2 points
Existing studies reviewed: no significant effect5 of 10
Existing studies reviewed: significant decrease4 of 10
Existing studies reviewed: significant increase1 of 10
How to read it: the first two rows are how much further turnout fell in each state than in the four comparison states over the same four years, in percentage points. The last three rows are not percentages of anything; they count how many of the ten studies the GAO reviewed landed in each category.
The GAO also looked inside those totals. Turnout fell further among African American registrants than among white registrants in both states: by 3.7 points more in Kansas and 1.5 points more in Tennessee. It found no consistent equivalent for Asian American or Hispanic registrants, which it took as evidence the laws did not have larger effects on those groups.
Both states disputed the findings. Kansas and Tennessee officials disagreed with how the comparison states were chosen and questioned the reliability of one of the three datasets. The GAO answered that no evaluation outside an experiment can account for every unobserved factor, and stood by the method.
The Study That Started the Argument, and What Happened to It
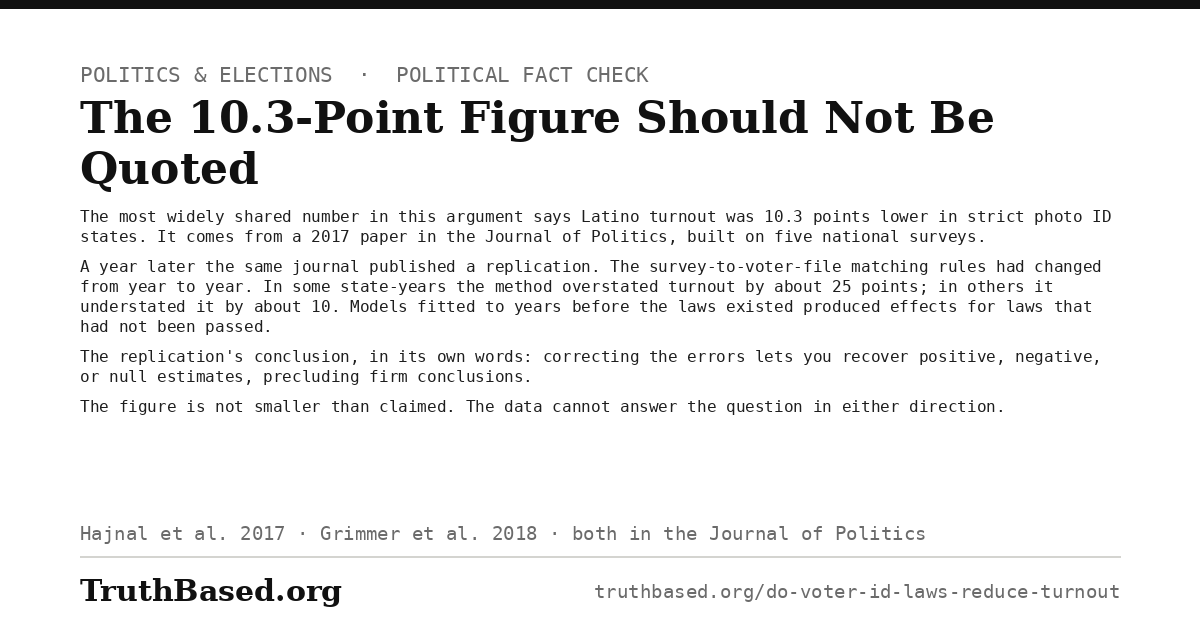
The figure that circulates most widely comes from a 2017 paper in the Journal of Politics by Zoltan Hajnal, Nazita Lajevardi and Lindsay Nielson. Using validated turnout from five national surveys between 2006 and 2014, it reported that Latino turnout in general elections was 10.3 points lower in strict photo ID states, and turnout among multiracial Americans 12.8 points lower.
Those are very large numbers. They are also the ones you will see quoted without the next part.
They are not even stable across the authors’ own accounts. Writing in the Los Angeles Times about the same research, Hajnal gave the Latino general-election gap as 7.1 points rather than 10.3, and the primary gap as 5.3 rather than 6.3. Both sets come from the same data. Which number you meet depends on which specification is being described.
A year later, in the same journal, Justin Grimmer, Eitan Hersh, Marc Meredith, Jonathan Mummolo and Clayton Nall replicated the paper and published what they found. The survey-to-voter-file matching criteria had changed from year to year, which generated errors correlated with time. In some state-years the method overstated turnout by around 25 points; in others it understated it by about 10. In some cases matched turnout came out at essentially zero. Models fitted to years before the laws existed produced apparent effects of laws that had not yet been passed.
The finding that matters
Their conclusion, in their own words: when the errors are corrected, one can recover positive, negative, or null estimates of the effect of voter ID laws on turnout, precluding firm conclusions.
That is not a smaller effect. It is a statement that this data and this design cannot answer the question in either direction.
The original authors replied in the same issue, and their reply is narrower than the original paper. They argued the key test is not whether overall turnout is lower in strict ID states but whether the laws fall differentially on minority voters, and stated that this point was not in dispute. That is a defensible position. It is not the 10.3-point figure, and anyone quoting the 10.3 should know it was disputed on the data and that the authors moved to different ground.
There is a separate finding here that survives all of this. Bernard Fraga and Michael Miller linked Texas voter files to the records of people who cast a ballot in 2016 under the state’s reasonable-impediment procedure. Black voters were 11.4% of Texans who voted with identification and 16.1% of those who voted without it. Latino voters were 19.8% of those who voted with, and 20.7% of those who voted without. Those ballots counted. The burden of getting them counted was not evenly spread. That is a disparity in the mechanics of voting, measured on administrative records rather than survey recall, and it is untouched by the argument above.
Download this section
The figure that circulates most, and what happened to it in the journal that published it.
What Photo ID Can Address
Photo ID at a polling place stops one thing. It stops a person turning up and voting as someone else. It does not touch mail ballots, registration, or anything done by an official. So the question is not how much election fraud exists. It is how much of that one type exists.
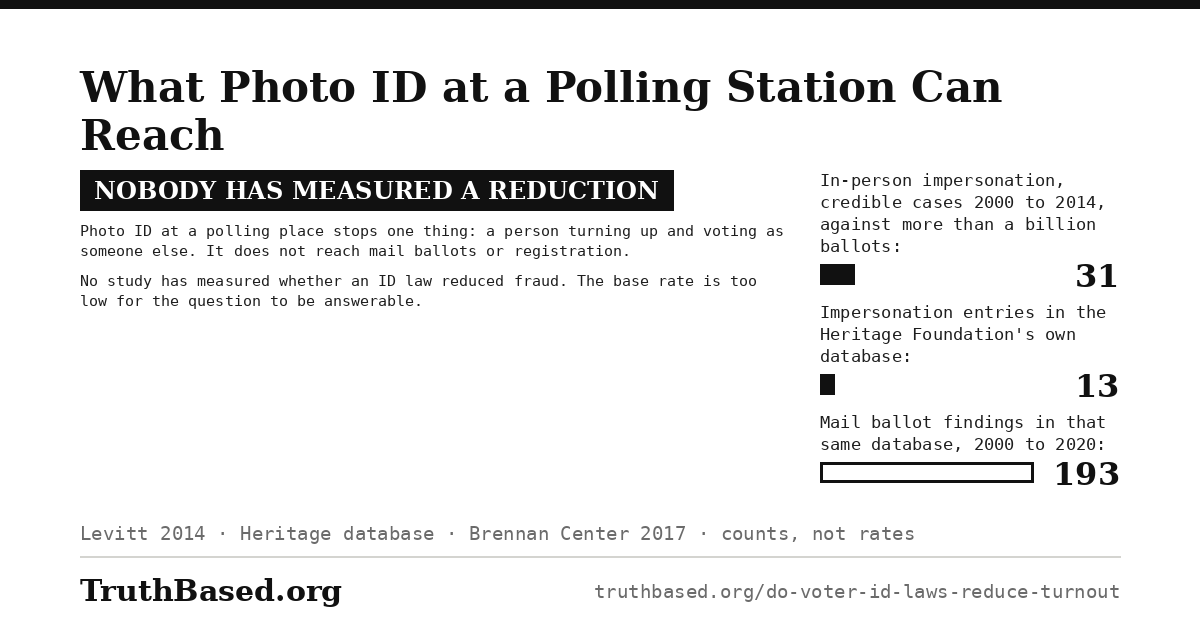
The most cited measurement is Justin Levitt’s, published in 2014: 31 credible incidents of voter impersonation out of more than one billion ballots cast between 2000 and 2014. Levitt himself expected some of the 31 to fall away on closer inspection.
The Heritage Foundation maintains a database of proven election fraud cases and is the source most often cited on the other side. It is an advocacy organisation and the database is presented as a sampling rather than a complete count, which Heritage states plainly. Taking it entirely at its own word still produces the same answer on this specific question.
Note on the Heritage figure and its date
Two numbers from this database get set against each other, and they are from different years. The Brennan Center reviewed it in 2017, when it held roughly 1,100 entries, and found 10 cases of in-person impersonation and 41 involving non-citizens across five decades. The database has since grown by roughly half; the total this site uses, checked on the voter fraud page, is 1,619 entries covering 1982 to 2025. Later snapshots of the database put impersonation at 13 rather than 10.
Quoting the current total against the 2017 subset compares figures from different years and makes the gap look larger than it is. The honest comparison is either 10 against about 1,100, or 13 against 1,619. Either way impersonation is under one percent of the entries.
Heritage’s own case mix makes the point more sharply than any critic could. Its database records 193 official findings for fraudulent use of mail ballots between 2000 and 2020, a period in which about 250 million mail ballots were cast. Mail ballots produce far more of its cases than in-person impersonation does. Photo ID at a polling station does nothing about mail ballots.
What photo ID reaches, and what it does not
Each figure below is a count of cases, not a rate
In-person impersonation, credible incidents 2000–2014 (Levitt), against more than a billion ballots31
In-person impersonation entries in the Heritage database, later snapshot13
Mail ballot findings in the same database, 2000–2020, against about 250 million mail ballots193
All entries in that database, 1982–20251,619
Studies measuring whether an ID law reduced fraud0
How to read it: these are counts of cases collected over decades, not rates, and they are not on the same denominator, so they cannot be compared against each other directly. What they show is the shape of the problem. The two rows photo ID can address are the first two. The row it cannot address, mail ballots, is the larger one, and it is larger in the database an organisation that wants to find fraud built itself.
Courts that have examined the question have made the same finding on the record. In Crawford, the case that upheld Indiana’s law at the Supreme Court in 2008, the majority opinion says the only kind of voter fraud the statute addresses is in-person impersonation at polling places, and that the record contains no evidence of any such fraud ever occurring in Indiana at any time in its history.
It upheld the law anyway. That is a legal conclusion rather than an empirical one, and the Court was explicit about what it rested on: a passage from the Carter-Baker commission holding that although there is no evidence of extensive fraud, the electoral system cannot inspire public confidence if no safeguards exist. The next section takes that argument seriously, because it is the one the Court actually accepted.
The question nobody has answered
No study measures whether ID laws reduced fraud. Not one. The base rate of in-person impersonation is so low that a before-and-after comparison has nothing to detect. Cantoni and Pons report no effect on fraud, actual or perceived, but what the literature establishes is how rare this kind of fraud is, not that a law made it rarer.
Download this section
What polling-place identification reaches, set against what it does not, in counts rather than rates.
The strongest case for the laws, stated properly
The case does not depend on impersonation being common, and the better advocates do not claim it is.
It runs like this. A safeguard against a rare crime is not worthless because the crime is rare; locks on doors are not refuted by low burglary rates in a neighbourhood. The best-identified national study finds no turnout cost, and rules out anything above half a point, so the safeguard appears close to free. Most peer democracies require identification to vote and nobody calls them voter suppressors. And the burden, where it exists, falls on a step that most citizens complete routinely for banking, travel and employment.
Two of those four hold up. The rarity argument is coherent. The Cantoni and Pons result is real and is the strongest single piece of evidence any side has.
There is a fifth point, and it is the sharpest. In the Indiana case the district judge found that the challengers had not produced evidence of a single individual resident who would be unable to vote because of the law, and rejected as unreliable an expert estimate that up to 989,000 registered Indiana voters lacked acceptable identification. A claim that a law disenfranchises people is owed at least one person it disenfranchised, and in that record nobody produced one.
The international comparison is weaker than it looks, and it fails on a detail rather than on principle. Countries that require ID generally hand it out free and near-universally as civic infrastructure. Mexico’s voter card is free and held by almost every registrant. India issues its elector card free and reports over 99% coverage. Canada does not require photo ID at all and permits vouching. The United Kingdom, which introduced photo ID in 2023, created a free Voter Authority Certificate alongside it. The comparison is not between the United States and countries that require ID. It is between the United States and countries that require ID and supply it.
The fourth claim runs into the cost evidence. A free card is not a free process when the documents needed to obtain it are not free, and the litigation record in Wisconsin and Texas documented both the shortfall between IDs estimated as needed and IDs actually issued, and the racial skew in who lacked one.
The claim that has been tested and failed
The most common argument for these laws is not about fraud at all. It is that requiring ID increases public confidence in elections. That is a testable claim and it has been tested. Researchers examining public opinion across states found that people living under voter ID laws do not report greater confidence in elections, nor lower perceived rates of impersonation. Confidence tracks whether your side won. It does not track the ID regime.
What Would Settle It
1. A well-identified individual-level study, built on administrative records rather than survey recall, finding subgroup turnout effects with a confidence interval that excludes zero. That would establish the suppression claim. Nothing currently in the peer-reviewed record does it.
2. A documented, prosecuted pattern of in-person impersonation large enough to have plausibly changed an outcome. That would establish the fraud-prevention claim. Five decades of case collection by an organisation that wants to find it has produced double figures.
3. A state that adopts a strict ID law and issues free identification universally, on the Mexican or Indian model, would separate the ID requirement from the document-cost problem. Nobody has run that experiment in the United States.
The verdict: what the evidence shows
1. The largest and best-identified study finds no aggregate turnout effect and rules out a reduction greater than half a percentage point. That is a real result on 1.6 billion observations and it is the strongest evidence in this argument.
2. Single-state studies of Georgia, North Carolina, Rhode Island and South Carolina have found declines, one Virginia study found an increase, and the GAO found declines of roughly 2 to 3 points in Kansas and Tennessee. A national null and these local findings are not contradictory, but the national study is the more demanding design.
3. The 10.3-point figure for Latino turnout should not be quoted. A replication in the same journal showed the underlying data yield positive, negative or null estimates depending on how matching errors are handled, and the original authors moved to a narrower claim.
4. The disparity that survives every methodological fight is about mechanics rather than counts. In Texas in 2016, Black voters were 11.4% of those who voted with identification and 16.1% of those who had to vote without it.
5. In-person impersonation, the only thing polling-place ID addresses, is measured at 31 credible cases against more than a billion ballots. Heritage’s own database finds far more mail-ballot cases than impersonation cases, and mail ballots are exactly what photo ID does not touch.
6. No study has ever measured whether an ID law reduced fraud. The base rate is too low for the question to be answerable.
7. The confidence argument, which is the most common justification offered, has been tested and is not supported.
Download the conclusion
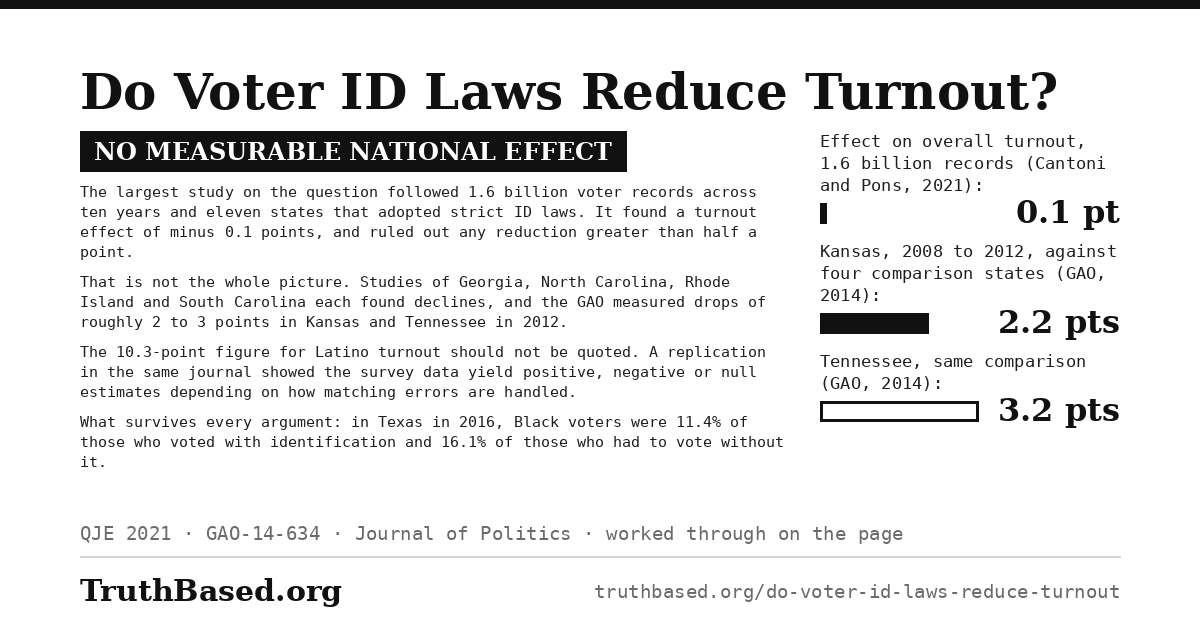
This card carries the three turnout figures the article turns on, drawn to scale, with the sources named on it. It is 1,200 by 630 pixels, the size social networks use for link previews, and anyone may download it and post it.
What would change this conclusion
1. A well-identified individual-level study built on administrative records rather than survey recall, finding subgroup turnout effects with a confidence interval that excludes zero. That would establish the suppression claim. Nothing currently in the peer-reviewed record does it.
2. A documented, prosecuted pattern of in-person impersonation large enough to have plausibly changed an outcome. That would establish the fraud-prevention claim. Five decades of case collection by an organisation that wants to find it has produced double figures.
3. A state adopting a strict identification law while issuing free identification universally, on the Mexican or Indian model, would separate the requirement from the document-cost problem. Nobody has run that experiment in the United States.
Sources
Cantoni, E. and Pons, V. “Strict ID Laws Don’t Stop Voters: Evidence from a U.S. Nationwide Panel, 2008–2018.” Quarterly Journal of Economics 136(4), November 2021, pp. 2615–2660. Source for the 1.6 billion observations, the −0.1 point estimates on turnout and registration with 95% confidence intervals of −3.0 to +2.8 and −2.3 to +2.1, the +1.4 point non-white relative effect with an interval of −0.5 to +3.2, the 4.7 point rise in campaign contact with non-white voters, the ability to rule out a reduction greater than 0.5 points, and the statement that strict ID requirements have no effect on fraud, actual or perceived. Read from the NBER working paper text of the same study. nber.org
Grimmer, J., Hersh, E., Meredith, M., Mummolo, J. and Nall, C. “Obstacles to Estimating Voter ID Laws’ Effect on Turnout.” Journal of Politics 80(3), 2018, pp. 1045–1051. Source for the replication of Hajnal, Lajevardi and Nielson, the finding that the results are a product of data inaccuracies, and the conclusion that correcting the errors allows positive, negative or null estimates to be recovered, precluding firm conclusions. journals.uchicago.edu
Hajnal, Z., Lajevardi, N. and Nielson, L. “Voter Identification Laws and the Suppression of Minority Votes.” Journal of Politics 79(2), 2017, pp. 363–379. Source for the 10.3 point Latino and 12.8 point multiracial general-election figures, and for the survey-based design the replication examined. The authors’ reply appears in the same 2018 issue as the replication, at pp. 1052–1059.
U.S. Government Accountability Office, GAO-14-634, “Elections: Issues Related to State Voter Identification Laws”, September 2014. Source for the Kansas estimate of 1.9 to 2.2 points and the Tennessee estimate of 2.2 to 3.2 points between the 2008 and 2012 general elections, for the four comparison states, for the review finding 5 of 10 studies with no significant effect, 4 with significant decreases and 1 with an increase, and for the GAO’s own statement that its estimates do not apply to other states or periods.
Single-state studies. Decreases reported for Georgia (Hood and Bullock, 2012), North Carolina (Grimmer and Yoder, 2021), Rhode Island (Esposito, Focanti and Hastings, NBER working paper 25503, 2019) and South Carolina (Hood and Buchanan, 2020); an increase reported for Virginia (Hopkins et al., 2017). The body of state-level work that runs against the national null. No estimate from any of them is quoted on this page; they are cited for their direction, not their size.
Fraga, B. and Miller, M. “Who Do Voter ID Laws Keep From Voting?” Journal of Politics 84(2), 2022. Source for the Texas reasonable-impediment finding. The figures used here, that Black voters were 11.4% of Texans who voted with identification in 2016 and 16.1% of those who voted without, and Latino voters 19.8% and 20.7%, are as reported by FiveThirtyEight, which is secondary reporting of a paywalled article and is flagged as such.
Levitt, J. “A comprehensive investigation of voter impersonation finds 31 credible incidents out of one billion ballots cast.” Washington Post, 6 August 2014. Source for the 31 credible incidents between 2000 and 2014 against more than one billion ballots, and for Levitt’s own expectation that some of the 31 would not survive scrutiny.
Heritage Foundation, Election Fraud Database. An advocacy organisation’s compilation, cited here for its own figures and its own stated method. Heritage describes the database as a sampling rather than a complete count and says it may undercount, since it records only cases that were prosecuted. Source for the 193 official findings on fraudulent use of mail ballots between 2000 and 2020. The database total of 1,619 entries covers 1982 to 2025. heritage.org
Brennan Center for Justice, “Heritage Fraud Database: An Assessment”, 2017. An advocacy organisation on the other side, cited for its own count and method. Source for the finding of 10 in-person impersonation cases and 41 non-citizen cases in the version of the database then holding roughly 1,100 entries. brennancenter.org
National Conference of State Legislatures, “Voter ID Laws”. Source for the strict and non-strict definitions quoted in Part One, and for the count of 36 states requesting or requiring identification. ncsl.org
Crawford v. Marion County Election Board, 553 U.S. 181 (2008). Opened at origin. Source for the majority’s statement that the only kind of voter fraud the Indiana statute addresses is in-person impersonation at polling places and that the record contains no evidence of any such fraud ever occurring in Indiana; for the Carter-Baker passage on public confidence that the Court relied on; and for the district court’s findings that no individual Indiana resident unable to vote under the law had been identified and that the 989,000 estimate was rejected as unreliable.
International comparison. Mexico’s Instituto Nacional Electoral issues the credencial para votar free; India’s Election Commission issues the elector photo identity card free and reports coverage above 99%; Elections Canada permits two non-photo documents or vouching in place of photo identification; the United Kingdom introduced photo identification under the Elections Act 2022 with a free Voter Authority Certificate. Cited for the design of those schemes, not for turnout figures.
Note on two different vintages of the same database. The Heritage total and the Brennan count are separated by roughly eight years and are not a like-for-like comparison. Brennan’s 10 impersonation cases were counted in 2017 against a database of about 1,100 entries. Heritage’s total has since grown past 1,500, and later snapshots of the database record 13 impersonation cases. Both counts are given above with the year they were taken.
Note on what the turnout figures are, and are not. None of the estimates on this page is a measurement of people prevented from voting. They are differences in turnout between states that changed their law and states that did not, which capture the net of any deterrence and any counter-mobilisation. The Texas figure in Part Four is different in kind. It counts people who did vote, and records what they had to do to have the ballot counted.
Cite this article
TruthBased.org. "Do Voter ID Laws Reduce Turnout?" September 2026. https://www.truthbased.org/do-voter-id-laws-reduce-turnout