Groups & Crime
Do Violent Offending Rates Differ by Race?
The rates themselves, and what survives the controls.
Crime & Justice
Which Side Commits More Political Violence?
Deaths and attacks by side in the counts of CSIS, Cato, New America and ADL, and what moves the totals.
Groups & Crime
Do Immigrants Commit More Crime?
No: 674 undocumented and 303 legal immigrants incarcerated per 100,000 against 1,195 native-born in Cato’s estimates from the 2024 American Community Survey, Texas arrest rates say the same, and why Europe differs.
Are the Racial Violence Statistics Being Misread?
Three questions get answered with the same numbers: whether violence was racially motivated, whether it crossed racial lines, and whether rates differ. The FBI table people screenshot, Britain’s grooming gangs figure and Europe’s records, and what each can and cannot show.
Jump to the verdict ↓
What this covers
This covers the United States, England and Wales, and Europe, in separate sections because the data systems are not comparable. It does not rank groups by criminality.
The short answer
Yes, both ways. The FBI table people screenshot is real, but it is a count with no population figure and no motive field, so it gives no rate and shows no hate crime. The other way round, a data gap, as on grooming gangs, is not a finding of no difference.
Three questions, one set of numbers
Three questions get argued with the same statistics, and each needs different data.
Whether the violence was racially motivated is a question about hate crime; it needs a record that someone judged the motive, a police bias flag, a prosecution decision or a victim saying so in a survey. Whether it crossed racial lines is a question about interracial crime; it needs only the recorded race of victim and offender, whatever the motive. Whether rates differ between groups is a question about disparity; it needs a numerator, a population denominator and a reason to think the two describe the same people.
The first thing to ask of any number in this area is which of the three it answers.
What each instrument can see
Four systems produce these figures. Arrest data records who police apprehend; police-recorded crime, incidents reported and logged under a counting rule; victimisation surveys, what people say happened to them; conviction data, court outcomes. A claim that holds in one and reverses in another is a finding about the instrument.
A recorded count can rise through reporting, recording, investigation, clearance or classification, none of which is offending, so a rise has to be attributed before it means anything. And missing data is not neutral: where many records have no offender attached, the missing cases are not a random sample, and a claim built on the known share covers only recorded, classified crime with a known offender.
The FBI table people screenshot
The table in the screenshots is Expanded Homicide Data Table 6 of the FBI's Crime in the United States, "Race, Sex, and Ethnicity of Victim by Race, Sex, and Ethnicity of Offender"; below is its 2019 edition.
| Race of victim | Total | White offender | Black offender | Other | Unknown |
|---|---|---|---|---|---|
| White | 3,299 | 2,594 | 566 | 56 | 83 |
| Black | 2,906 | 246 | 2,574 | 23 | 63 |
| Other race | 247 | 57 | 40 | 138 | 12 |
| Unknown race | 126 | 51 | 38 | 8 | 29 |
It holds under half of the FBI's own file, which had supplementary data for 13,927 murder victims in 2019. Of those, 7,047, 50.6%, died in incidents with one victim and one offender; Table 6 keeps only those, and only where police knew something about the offender. Its four rows sum to 6,578.
The relationship between victim and killer was unknown for 6,808 victims, 48.9%, but the offender was unknown for fewer, 3,870. Police cleared 61.4% of 2019's murders, by charging someone or identifying an offender they could not charge. The offender's race was unknown for 4,752 of the file's 16,245 offenders. In the FBI's figures for 2025, the relationship was unknown for 41.1% and 68.8% of murders were cleared.
A table of victim race by offender race can only hold cases where something is known about the offender, and those are not a random sample of all murders: clearance ran from 51.5% to 69.4% across the FBI's kinds of place, and in 2023, by the Bureau of Justice Statistics' estimates, 54% of homicides of black victims went uncleared against 42% of white victims.
Every figure in the table is a count. Comparing 566 with 246 means dividing each by its group's population, which the table does not give.
Race and ethnicity are separate fields, and nearly a third of the offender ethnicity entries are unknown. For the 3,299 white victims, 738 offenders were recorded Hispanic or Latino, 1,542 not Hispanic or Latino, and 1,019 unknown. A Hispanic offender is also counted under a race, so "White offender" here is not a count of non-Hispanic white offenders, and nothing in the table lets you produce one.
The table has no motive field, so it cannot show hate crime.
How to read it: each bar counts murder victims in the FBI's 2019 file, from everyone in the file down to the two interracial counts inside the screenshotted table; the values are below. Source: FBI, Crime in the United States 2019, Expanded Homicide Data Tables 1, 6 and 10.
| Bar | Victims |
|---|---|
| All murder victims in the file | 13,927 |
| Relationship to killer unknown | 6,808 |
| In the screenshotted table (one victim, one offender) | 6,578 |
| White victim, black offender | 566 |
| Black victim, white offender | 246 |
The disparity that runs the other way
Police records also give a victim rate, which the screenshots leave out.
The Bureau of Justice Statistics puts the homicide victimisation rate in 2024 at 18.3 per 100,000 for black Americans and 2.2 for white Americans, about 8 to 1, with Hispanic victims of any race counted separately. It is a rate with a stated population base, estimated from police records the FBI collects through its newer incident-based system rather than the supplementary reports behind Table 6, and a victim's race is a required entry in those records, so the rate does not depend on the case being solved.
The Violence Policy Center, working from CDC mortality data for the same year because it finds the FBI's data less reliable for some states since the 2021 reporting change, puts the rates at 22.4 and 3.5, about 6 to 1, counting Hispanic victims inside each race. The figures differ in source, in method, since the Center adjusts its rates for age, and in where Hispanic victims sit, and they point the same way.
Download this conclusion: the rate the screenshots leave out
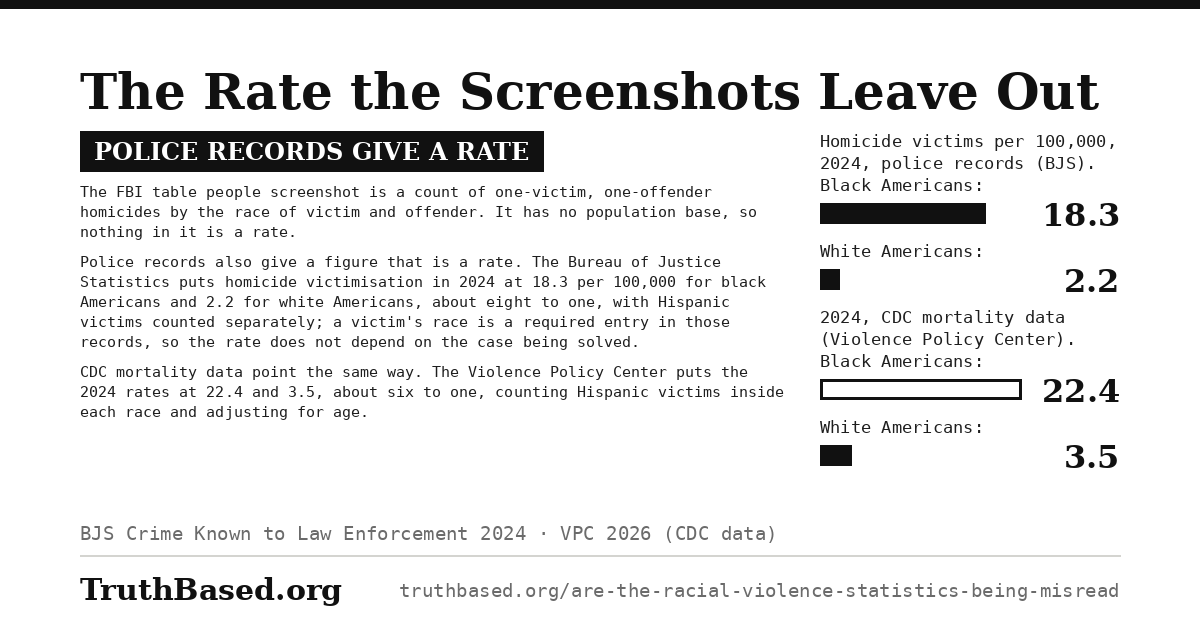
This section as one image: the victimisation rate from police records, and the CDC rate beside it.
How to read it: each bar is homicide victims per 100,000 people of that group in 2024, a rate with a population base. The first pair is BJS's estimate from police records, which counts Hispanic victims separately; the second is the Violence Policy Center's from CDC mortality data, adjusted for age, which counts them inside each race. Sources: BJS, Crime Known to Law Enforcement, 2024; Violence Policy Center, Black Homicide Victimization, 2024 data.
| Bar | Rate |
|---|---|
| Black Americans, 2024 (police records) | 18.3 |
| White Americans, 2024 (police records) | 2.2 |
| Black Americans, 2024 (CDC mortality data) | 22.4 |
| White Americans, 2024 (CDC mortality data) | 3.5 |
Why 2021 broke the American series
On 1 January 2021 the FBI stopped taking data through its old Summary Reporting System and accepted only the National Incident-Based Reporting System, so agencies that had not converted were missing. In the FBI's and BJS's figures, 65% of the population was covered in 2021, against about 95% in earlier years, and some large agencies did not submit. The FBI began collecting summary data again in 2022.
The FBI's 2021 figures are estimates, with the missing agencies filled in statistically and confidence intervals attached, and the FBI now notes that they are not nationally representative or comparable with other years.
American hate crime counts are a participation statistic
Most police agencies report hate crime to the FBI voluntarily, and an agency can report incidents, report that it had none, or send nothing. In 2025, 16,791 agencies took part and about 2,800 enrolled ones sent nothing; more than four in five of those taking part reported no hate crime at all.
To get what it calls "a meaningful national trend", the FBI counts only agencies that reported the same six or more months in both years. On that like-for-like basis incidents fell 0.6% from 2022 to 2023, the year the all-agency total rose to 11,862 and groups such as the Anti-Defamation League called it a record. In 2025 both counts fell, the like-for-like one by 7.0%.
The National Crime Victimization Survey estimated about 244,000 hate crime victimisations a year in 2010 to 2019; police recorded 6,628 hate crime incidents in 2010 and 7,314 in 2019. The Bureau of Justice Statistics puts most of the gap down to victims not reporting and to how police classify what is reported. The FBI series counts what participating police record as hate crime.
England and Wales records ethnicity
Section 95 of the Criminal Justice Act 1991 requires the government to publish information that helps those working in criminal justice avoid discrimination. The Ministry of Justice's compendium on ethnicity, published under it, follows each group from stop and search to prison, though at least a third of court defendants have no recorded ethnicity.
The ministry warns that for most of its figures "no controls have been applied" for other characteristics, such as average income, geography, offence mix or offender history, and that differences "should not be taken as evidence of bias or as direct effects of ethnicity".
The Home Office compares each group's stop and search rate per 1,000 residents with the white rate; in the year to March 2025 the rate was 22.4 for black people and 5.9 for white people, 3.8 times as high. It also warns that a national rate "presumes that all stop and searches and ethnic groups are spread evenly across forces". London's Metropolitan Police made 23% of searches that year, in an area where 46% of residents are not white, against 13% elsewhere.
Two studies from 2000 and 2004 counted who was out where searches happened. A 2007 review by Ben Bowling and Coretta Phillips reports that, measured against those counts, white people tended to be searched at a higher rate and Asian people to be under-represented, while black people were sometimes under- and sometimes over-represented. The Home Office's figures also show about three searches in ten find something, for every ethnic group. None of these figures settles whether the searching is biased.
The grooming gangs figure, and what replaced it
The claim is that 84% of grooming gang offenders are Asian. It comes from a 2017 Quilliam Foundation report that, according to a Home Office literature review in 2020, counted 264 people convicted between 2005 and 2017 but did not say how it found them or classified their ethnicity. The review said the findings could not support conclusions about offenders' ethnicity.
The Home Office's 2020 paper on group-based child sexual exploitation (CSE) says in its foreword that some studies "indicated an over-representation of Asian and Black offenders" but that it is "difficult to draw conclusions" because research is limited and data collection poor. Its summary says research has found offenders "most commonly White", that some studies suggest black and Asian offenders are over-represented, and that "it is not possible to conclude that this is representative of all group-based CSE offending".
Paragraph 81 finds it is not possible to say whether Asian or black offenders are over-represented, yet that "it seems most likely" offenders' ethnicity is in line with the general population, mostly white; the paper's own analysis of police data "would not answer the question". The line "no credible evidence that any one ethnic group is over-represented" is not in the paper. It is two academics' summary in the Guardian four days later.
In June 2025 Baroness Casey's national audit found that ethnicity is still not recorded for two thirds of perpetrators, so the national data cannot support conclusions either way. Local police data from three force areas showed "disproportionate numbers of men from Asian ethnic backgrounds amongst suspects"; with local reviews and prosecutions, she judged this enough "to at least warrant further examination". She wrote that flawed data is used "repeatedly to dismiss claims about 'Asian grooming gangs' as sensationalised, biased or untrue", and that claims of an overwhelming problem with white perpetrators "can't be proved".
So neither side's national claim has a source that can carry it. The government promised then to make police record perpetrators' ethnicity and nationality; a year later the Home Secretary said she lacked the power to require it and would seek it in a Police Reform Bill.
Download this conclusion: the grooming gangs figure
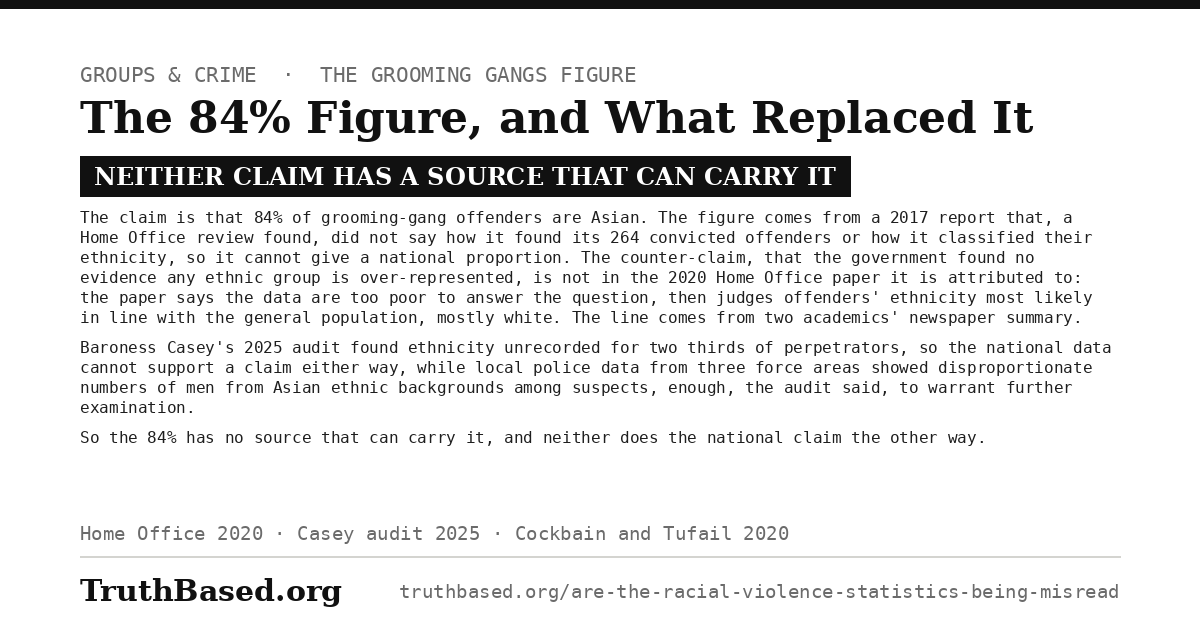
This section as one image: where the 84% came from, what the 2020 Home Office paper judged, and what the 2025 Casey audit found nationally and locally.
Hate crime figures in England and Wales measure recording
Police in England and Wales recorded 31,844 hate crimes in the year to March 2013 and four times as many, 128,485, in the year to March 2022; in the year to March 2025 they recorded 115,990. The Home Office puts the rise down to better crime recording and better identification of hate crime, and says its figures do not provide reliable trends since 2014 and are not a good measure of prevalence.
Those figures leave out London's Metropolitan Police. Its old system marked every offence in a crime report as a hate crime if one of them was, so the higher totals published before October 2025, which included its figures, overstated the count.
The Crime Survey for England and Wales, which asks victims directly and is unaffected by changes in police recording, shows a 43% fall instead, from 307,000 incidents a year in the surveys of April 2007 to March 2009 to about 176,000 in those of April 2022 to March 2025. The Home Office puts the difference mainly down to better police recording, and notes that public order offences, over half of the police count, are not well covered by the survey.
France, Germany and Sweden count nationality or background, not ethnicity
French law forbids processing data that reveals racial or ethnic origin, with exceptions, and French crime statistics sort suspects by nationality. German police statistics, as Bundestag papers and the fact-checker CORRECTIV describe them, count suspects as German or non-German by citizenship and record no migration background. Sweden's crime prevention council's 2021 study counted suspects by background, meaning where the person and their parents were born. The European Commission reports a lack of comparable equality data across member states, with some collecting such data and others consciously avoiding it.
So "in Europe, group X commits Y times more crime" rests on a proxy, and the proxies differ. Nationality changes on naturalisation; country of birth misses the second generation; migration background is defined by citizenship at birth in Germany, where one parent suffices, and in Sweden by where the person and both parents were born.
The Nordic countries that publish crime by background publish adjusted versions too. Norway's statistical office found 11.3% of the Norwegian-born children of immigrants registered as offenders in 2010 to 2013, against 4.5% of the rest of the population; adjusting for age and sex cut that to 6.8%.
The EU's Fundamental Rights Agency surveys, including one of almost 6,800 people of African descent, measure discrimination, harassment, violence and police stops as respondents experienced them, not offending rates for any group. ODIHR, which publishes the OSCE's hate crime figures, says its data cannot be used to compare countries, because what each state records and classifies as hate crime differs.
The verdict: what the evidence shows
Yes, both ways. The FBI table at the centre of the argument is genuine: a count of one-victim, one-offender murders in which police knew something about the killer, with no motive field and no population figure, holding under half of the 13,927 victims in the 2019 file. In that file the relationship between victim and killer was unknown for 48.9% of victims and the killer for 27.8%. Read as a rate or as motive, it answers a question it was never built for.
Police records also give a figure that is a rate. For 2024 the Bureau of Justice Statistics estimates 18.3 homicide victims per 100,000 black Americans against 2.2 for white, about eight to one with Hispanic victims counted apart; CDC mortality data give 22.4 against 3.5, about six to one with them counted inside each race.
Britain’s 84% grooming gangs figure has no source that can carry it, and the counter-claim, that the Home Office found no evidence of over-representation, is not in the paper credited with it. That paper said the data could not answer the question, then judged offenders’ ethnicity most likely in line with the general population, mostly white; the 2025 Casey audit found ethnicity unrecorded for two thirds of perpetrators nationally and disproportionate numbers of Asian men among suspects in three force areas. Hate crime counts move with who reports and how, and France, Germany and Sweden record nationality or background, not ethnicity. Counts get read as rates and motive, and missing data as a finding of no difference.
Six common claims, against the evidence
Claim“The FBI’s own table proves black-on-white violence is far more common than the reverse.”
Counts, not ratesTable 6 has no population figure and no motive field, so it holds no rate and no hate crime, and most of its murders are within-group, 2,594 of 3,299 white victims and 2,574 of 2,906 black victims.
Claim“The offender was never identified in half of all murders.”
Not what the tables say48.9% is the share of 2019 victims whose relationship to the killer was unknown; the offender was unknown for 3,870, 27.8%, and police cleared 61.4% of that year’s murders, 68.8% in 2025.
Claim“84% of grooming gang offenders are Asian.”
No source can carry itIt comes from a 2017 Quilliam Foundation report that, the Home Office’s 2020 literature review found, did not say how it found its 264 convicted offenders or classified their ethnicity.
Claim“The Home Office found no credible evidence that any ethnic group is over-represented.”
Not in the paperThe line is two academics’ Guardian summary. The 2020 paper said the research could not answer the question, then judged offenders’ ethnicity most likely in line with the general population, mostly white. Casey’s audit found disproportionate numbers of men from Asian backgrounds among suspects in three force areas.
Claim“Hate crime has tripled and hit a record high.”
Recording and participationIn England and Wales the police count quadrupled between the years to March 2013 and 2022; the Crime Survey’s estimate fell 43% between the surveys of 2007 to 2009 and those of 2022 to 2025, and the Home Office says its police figures give no reliable trend since 2014. The FBI’s 2023 “record” was the all-agency total; among agencies reporting in both years, incidents fell 0.6%.
Claim“In Europe, group X commits Y times more crime.”
A proxy, not ethnicityFrance, Germany and Sweden record nationality or where a person and their parents were born, not ethnicity, and the Nordic agencies that publish rates by background publish adjusted ones too: Norway’s 11.3% for the children of immigrants, against 4.5%, became 6.8% after age and sex.
Download the conclusion
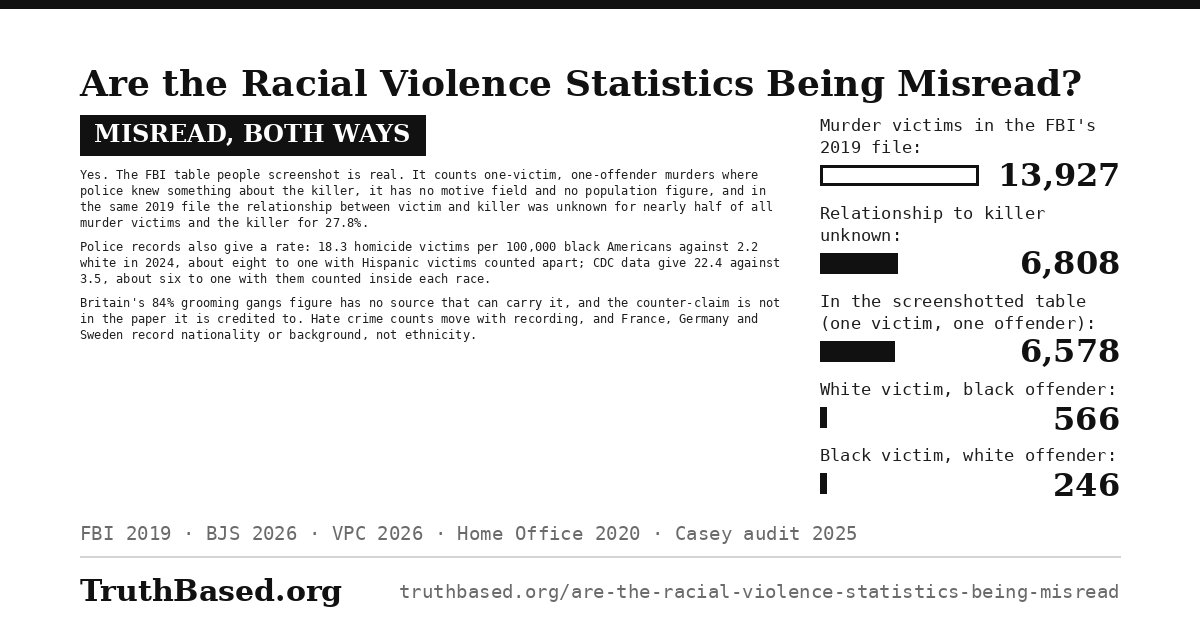
The verdict above as one image, with the FBI’s 2019 file drawn to scale: all its murder victims, those with no known relationship to their killer, those in the table people screenshot, and the two interracial counts. Anyone may download and post it.
What would change this conclusion
This article concludes that: (1) the FBI table people screenshot is a count with no motive field and no denominator; (2) police and CDC mortality data give a victim rate of six to eight times; (3) the 84% figure has no source that can carry it and the counter-claim is not in the 2020 paper; (4) hate crime counts move with participation and recording; (5) France, Germany and Sweden record nationality or background, not ethnicity.
These conclusions would be falsified by:
• A homicide series by offender race whose unknown share is small enough for the known cases to stand for all murders
• National data from the mandatory recording of suspects’ ethnicity in child sexual exploitation cases that the government accepted after the audit and, as of June 2026, still lacked the power to require
• A member state publishing offence data by a category that means what ethnicity means in British and American statistics
Sources
FBI. Crime in the United States 2019, Expanded Homicide Data Table 6, “Race, Sex, and Ethnicity of Victim by Race, Sex, and Ethnicity of Offender” [single victim/single offender]. Source for every figure in the victim-by-offender table, including the ethnicity-of-offender columns (738 Hispanic, 1,542 not Hispanic, 1,019 unknown for white victims), and for its note that the table holds only incidents where some information about the offender is known. ucr.fbi.gov
FBI. Crime in the United States 2019, Expanded Homicide overview. Source for the 13,927 murder victims with supplemental data, the 50.6% in single-victim, single-offender situations (Table 4), the 4,752 offenders of unknown race (Table 3) and the 6,808 victims (48.9%) whose relationship to the offender was unknown (Table 10). ucr.fbi.gov
FBI. Crime in the United States 2019, Expanded Homicide Data Table 4, “Murder by Victim/Offender Situations”. Source for the 7,047 victims (50.6%) in single-victim, single-offender situations and the 3,870 (27.8%) whose offender or offenders were unknown. ucr.fbi.gov
FBI. Crime in the United States 2019, Expanded Homicide Data Table 10, “Murder Circumstances by Relationship”. Source for the 6,808 victims whose relationship to the offender was unknown, 48.9% of 13,927. ucr.fbi.gov
FBI. Crime in the United States 2019, Expanded Homicide Data Table 3, “Murder Offenders by Age, Sex, Race, and Ethnicity”. Source for the 16,245 offenders in the file and the 4,752 of unknown race. ucr.fbi.gov
FBI. Crime in the United States 2019, Table 25, “Percent of Offenses Cleared by Arrest or Exceptional Means by Population Group”. Source for the 61.4% of murder offenses cleared in 2019 and the range from 51.5% to 69.4% across population groups. ucr.fbi.gov
FBI. Reported Crimes in the Nation, 2025: Quick Stats, and UCR Summary of Reported Crimes in the Nation, 2025, August 2026; FBI Releases 2023 Crime in the Nation Statistics, 24 September 2024. Source for the 2025 figures on victim-offender relationship (unknown in 41.1%) and murder clearance (68.8%); for hate crime participation (16,791 agencies in 2025, of which 81.7% reported no hate crimes), the 2023 all-agency total of 11,862 incidents, and the trend the FBI builds from agencies reporting six or more common months in both years, down 0.6% from 2022 to 2023 and 7.0% from 2024 to 2025; and for the note that the 2021 estimates are not nationally representative or comparable with other years. cde.ucr.cjis.gov (Quick Stats) cde.ucr.cjis.gov (2025 summary) fbi.gov (2023 release)
Bureau of Justice Statistics. Crime Known to Law Enforcement, 2024. Remrey and Smith, NCJ 310856, March 2026. Source for the 2024 homicide victimisation rates of 18.3 per 100,000 for non-Hispanic black and 2.2 for non-Hispanic white residents (table 5), estimated from NIBRS data. bjs.ojp.gov
Bureau of Justice Statistics. Homicide Victimization in the United States, 2023. Remrey, NCJ 309889, May 2025. Source for the 2023 clearance shares by victim race (54% of homicides of black victims not cleared, against 42% of white victims) and for victim race being a required entry in NIBRS records. bjs.ojp.gov
Violence Policy Center. Black Homicide Victimization in the United States: An Analysis of 2024 Homicide Data, July 2026. Source for the age-adjusted rates of 22.4 per 100,000 for black and 3.5 for white victims from CDC mortality data, with Hispanic victims counted inside each race, and for its reason for using CDC rather than FBI data since the 2021 reporting change. vpc.org
Bureau of Justice Statistics and FBI Criminal Justice Information Services Division. Estimation Procedures for Crimes in the United States Based on NIBRS Data, August 2022 (NCJ 305108). Source for the move to NIBRS-only collection on 1 January 2021, the 65% population coverage for 2021 against 95% in earlier years, and the confidence intervals on the 2021 estimates. bjs.ojp.gov
FBI. Statement of Timothy A. Ferguson, Acting Assistant Director, Criminal Justice Information Services Division, before the House Judiciary Subcommittee on Crime and Federal Government Surveillance, 17 December 2024. Source for the large agencies that did not submit 2021 data and the resumed collection of summary data in 2022. justice.gov
FBI Criminal Justice Information Services Division. Hate Crime Data Collection Guidelines and Training Manual, version 3.0, 1 March 2022. Source for participation in the hate crime collection being voluntary for state, local, tribal and college agencies and mandatory for federal ones. le.fbi.gov
Bureau of Justice Statistics. Hate Crime Victimization, 2005–2019, September 2021. Source for the National Crime Victimization Survey’s average of 243,770 hate crime victimisations a year in 2010 to 2019, and for its finding that the difference from police counts can largely be attributed to victims’ reporting and police classification. bjs.ojp.gov
Bureau of Justice Statistics. Hate Crime Recorded by Law Enforcement, 2010–2019, September 2021 (NCJ 301554). Source for the FBI’s hate crime incident counts of 6,628 in 2010 and 7,314 in 2019. bjs.ojp.gov
Anti-Defamation League. New FBI Data Reflects Record-High Number of Anti-Jewish Hate Crimes, 23 September 2024. The description of 2023’s all-agency total, 11,862, as a record high. adl.org
Criminal Justice Act 1991, section 95 (as amended). The duty to publish information that helps those administering criminal justice avoid discriminating on the ground of race, sex or any other improper ground. legislation.gov.uk
Ministry of Justice. Statistics on Ethnicity and the Criminal Justice System, 2024, published 27 November 2025. The latest of the biennial compendiums published under section 95 of the Criminal Justice Act 1991. Source for the stages it covers, the shares of court defendants with no recorded ethnicity, and its caveat that for most of the report no controls have been applied and that differences should not be taken as evidence of bias or as direct effects of ethnicity. gov.uk
Home Office. Police powers and procedures: Stop and search, arrests and mental health detentions, England and Wales, year ending 31 March 2025, published 6 November 2025. Source for the rates of 22.4 searches per 1,000 black residents and 5.9 per 1,000 white residents and the disparity rate of 3.8 between them, the warning that a national rate presumes searches and ethnic groups are spread evenly across forces, the Metropolitan Police’s 23% of searches and its area’s 46% non-white population against 13% elsewhere, and the find rates by ethnic group. gov.uk
Bowling, B. & Phillips, C. (2007). Disproportionate and Discriminatory: Reviewing the Evidence on Police Stop and Search. Modern Law Review 70(6), 936–961. Source for what the Home Office’s 2000 study (MVA and J. Miller, Profiling Populations Available for Stops and Searches, Police Research Series Paper 131) and Waddington, Stenson and Don’s 2004 study in Reading and Slough found when searches were measured against the population available to be stopped. a copy at netpol.org
Waddington, P.A.J., Stenson, K. & Don, D. (2004). In proportion: race, and police stop and search. British Journal of Criminology 44(6), 889–914. Source for its replication of the Home Office’s 2000 profile of the population available in public places to be stopped and searched. doi.org
Rafiq, H. and Adil, M. (2017). Group Based Child Sexual Exploitation: Dissecting Grooming Gangs. Quilliam Foundation, since closed. Its figures are given as the Home Office’s 2020 literature review reports them.
Home Office. Characteristics of group-based child sexual exploitation in the community: literature review, October 2020 (published 15 December 2020). Source for Quilliam’s 264 offenders and 84%, and for the judgement that its findings are not suitable for drawing conclusions about ethnicity. gov.uk
Home Office. Group-based Child Sexual Exploitation: Characteristics of Offending, published 15 December 2020. Source for its foreword (by the Home Secretary), paragraph 17 of its summary, and paragraphs 80 and 81, quoted in the text. gov.uk
Cockbain, E. and Tufail, W. (19 December 2020). A new Home Office report admits grooming gangs are not a ‘Muslim problem’. The Guardian. Source of the line “no credible evidence that any one ethnic group is over-represented”. theguardian.com
Baroness Casey of Blackstock. National Audit on Group-Based Child Sexual Exploitation and Abuse, June 2025. Source for ethnicity unrecorded for two thirds of perpetrators, the national data not sufficient for conclusions, the disproportionate numbers of men from Asian ethnic backgrounds among suspects in three force areas’ local data, and the foreword’s and summary’s words quoted in the text. gov.uk
Hansard. Child Sexual Exploitation: Casey Report, House of Commons, 16 June 2025. The Home Secretary’s statement on the audit, naming the three force areas (Greater Manchester, West Yorkshire and South Yorkshire) and promising a formal requirement to collect ethnicity and nationality data in all cases of child sexual abuse and exploitation. hansard.parliament.uk
Home Secretary. Letter to the Chair of the Home Affairs Committee, 16 June 2026: Baroness Casey’s National Audit on Group-Based Child Sexual Exploitation and Abuse, One Year On. Source for the statement that the Home Secretary does not currently have powers to mandate the collection of ethnicity and nationality data and will seek them in the Police Reform Bill. a copy at beyondthevote.co.uk
Home Office. Hate crime, England and Wales, year ending March 2025, 9 October 2025. Source for the police-recorded counts (31,844 in the year to March 2013, 128,485 in the year to March 2022 and 115,990 in the year to March 2025, all excluding the Metropolitan Police, whose earlier figures the bulletin says were overstated), the statement that police figures do not provide reliable trends since 2014 and are not a good measure of prevalence, and the Crime Survey’s 43% fall to about 176,000 incidents a year. gov.uk
CNIL. Contribution to the CNCDH’s report on racism, 2020; SSMSI. Insécurité et délinquance en 2022: bilan statistique. Source for article 6 of the loi Informatique et Libertés on data revealing racial or ethnic origin, and for French crime statistics sorting suspects by nationality. cncdh.fr interieur.gouv.fr
Deutscher Bundestag. Drucksache 21/5748, 5 May 2026, and Drucksache 20/11398, 15 May 2024; Destatis, glossary entry “Migrationshintergrund”. Source for the Polizeiliche Kriminalstatistik counting suspects as German or non-German by citizenship and recording no migration background, and for Destatis’s definition of migration background. bundestag.de (2026) bundestag.de (2024) destatis.de
CORRECTIV. Auf1 verbreitet irreführende Behauptungen über Messerangriffe in Deutschland, 12 September 2024. Source, with the Bundestag papers, for the Polizeiliche Kriminalstatistik recording citizenship and not migration background. correctiv.org
Brå (Swedish National Council for Crime Prevention). Registered offending among persons of native and non-native background, report 2021:9, English summary, 2021. Source for Sweden’s classification by the person’s and parents’ country of birth. bra.se
Statistics Norway. Kriminalitet blant innvandrere og norskfødte med innvandrerforeldre (Reports 2017/36), December 2017. Source for the 11.3% of Norwegian-born children of immigrants and 4.5% of the rest of the population registered as offenders in 2010 to 2013, and the 6.8% after adjustment for age and sex. ssb.no
European Commission. Equality data collection. Source for the statement that comparable equality data are lacking across member states, with some collecting such data and others consciously avoiding it. commission.europa.eu
European Union Agency for Fundamental Rights. Being Black in the EU: Experiences of people of African descent, 2023. Source for the survey of almost 6,800 people of African descent and for what it measures: discrimination, harassment, violence and police stops as respondents experienced them. fra.europa.eu
OSCE Office for Democratic Institutions and Human Rights. Hate crime reporting: frequently asked questions. Source for ODIHR’s statement that its hate crime data cannot be used to compare countries, because what each state records and classifies as hate crime differs. hatecrime.osce.org
A companion question
This article is about what the circulating statistics measure. A separate piece sets out the offending rates themselves, with the population named for each figure and what survives the controls each country’s data allow.
Cite this article
TruthBased.org. “Are the Racial Violence Statistics Being Misread?” September 2026. https://www.truthbased.org/are-the-racial-violence-statistics-being-misread